DVBI-01 Fundamentals of Digital Marketing & E-Business
On This Page
Business Intelligence (BI)
- Business Intelligence (BI) refers to a collection of tools, technologies, processes, and strategies used to collect data from various sources, analyze it, and present it in a meaningful way.
- It helps organizations convert raw data into useful information that supports effective decision-making.
- BI involves activities such as data collection, data integration, data cleaning, analysis, and data visualization.
Role of Business Intelligence
1. Improved Decision-Making
- BI provides accurate, real-time, and historical data insights that help managers make informed decisions.
- Instead of relying on guesswork, organizations can use data-driven approaches to improve outcomes.
2. Performance Monitoring
- BI tools allow organizations to track key performance indicators (KPIs) such as sales, profit, and productivity.
- Dashboards and reports help in continuously monitoring business performance.
3. Trend Identification and Forecasting
- BI helps identify patterns and trends in data, which can be used to predict future outcomes.
- This supports better planning and strategic decision-making.
4. Operational Efficiency
- By analyzing business operations, BI helps in identifying inefficiencies and reducing unnecessary costs.
- It improves processes and increases overall productivity.
5. Competitive Advantage
- BI enables organizations to understand customer behavior, market trends, and competitor strategies.
- This helps businesses stay ahead in a competitive environment.
6. Time and Cost Savings
- Automated data processing and reporting reduce manual work and save time.
- It also reduces dependency on IT teams for generating reports.
7. Strategic Planning and Growth
- BI supports long-term planning by providing insights into opportunities, risks, and business performance.
- It helps organizations in achieving sustainable growth.
Applications of Business Intelligence
1. Sales Analysis
- BI is used to analyze sales data, track performance, and identify best-selling products.
- It helps in improving sales strategies and increasing revenue.
2. Financial Analysis
- BI helps in monitoring income, expenses, profit, and financial performance.
- It supports budgeting, forecasting, and financial planning.
3. Marketing Analysis
- BI analyzes customer behavior, preferences, and campaign performance.
- It helps businesses target the right audience and improve marketing strategies.
4. Human Resource Management
- BI is used to track employee performance, attendance, and attrition rates.
- It helps in workforce planning and improving employee productivity.
5. Supply Chain Management
- BI helps monitor inventory levels, supplier performance, and logistics.
- It improves efficiency and reduces operational costs.
6. Education and Academic Analysis
- BI is used in educational institutions to analyze student performance, attendance, and results.
- It helps in improving teaching strategies and academic outcomes.
7. Healthcare
- BI is used to analyze patient data, treatment outcomes, and hospital performance.
- It supports better diagnosis and healthcare management.
Role of BI Tools in Decision Making
- Business Intelligence (BI) tools play a crucial role in helping organizations make accurate, fast, and data-driven decisions.
- They collect, analyze, and present data in a meaningful way, enabling managers to understand business performance and take appropriate actions.
1. Data Collection and Integration
- BI tools gather data from multiple sources such as databases, ERP systems, and spreadsheets.
- They integrate this data into a single platform, providing a unified and consistent view for decision-making.
2. Data Analysis
- BI tools analyze large volumes of data using queries, calculations, and statistical methods.
- This helps in identifying patterns, trends, and relationships that are not easily visible.
3. Real-Time Insights
- BI tools provide real-time or near real-time data updates.
- Decision-makers can monitor current performance and respond quickly to changes.
4. Visualization and Reporting
- BI tools present data through dashboards, charts, graphs, and reports.
- Visual representation makes complex data easier to understand and interpret.
5. Performance Monitoring
- BI tools track key performance indicators (KPIs) such as sales, profit, and productivity.
- Managers can evaluate performance and take corrective actions when needed.
6. Predictive Analysis
- BI tools help in forecasting future trends based on historical data.
- This supports better planning and strategic decision-making.
7. Improved Accuracy and Reduced Risk
- Decisions are based on accurate and analyzed data rather than assumptions.
- This reduces errors and business risks.
8. Faster Decision Making
- Automated data processing and reporting save time.
- Managers can make quick decisions without waiting for manual reports.
9. Better Communication and Collaboration
- BI reports and dashboards can be shared across departments.
- This improves coordination and ensures everyone is working with the same data.
Architecture of BI
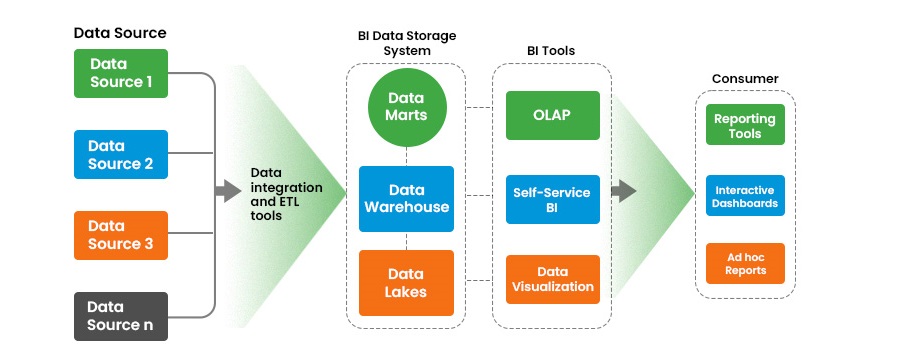
- BI architecture represents the structured framework that shows how data is collected, processed, stored, and used for decision-making.
- It defines the flow of data from raw sources to meaningful insights and final business decisions.
1. Data Sources
- Data is collected from various sources such as databases, ERP systems, transaction systems, spreadsheets, and external sources.
- These sources generate raw data from daily business operations.
2. ETL Process (Extract, Transform, Load)
- In this step, data is extracted from different sources, transformed into a clean and consistent format, and loaded into a central system.
- Data cleaning, filtering, and formatting are performed to ensure data quality and accuracy.
3. Data Warehouse
- The data warehouse is a centralized repository where integrated and historical data is stored.
- It is designed for efficient querying and analysis rather than transaction processing.
4. BI Tools / Reporting Layer
- BI tools are used to analyze data and generate reports, dashboards, and visualizations.
- These tools provide insights through charts, graphs, and summaries with limited or advanced interactivity.
5. Decision Making
- The final stage involves using insights generated from BI tools to support strategic and operational decisions.
- Managers and stakeholders use these insights to improve business performance.
Power BI
- Power BI is a Business Intelligence tool developed by Microsoft that helps users convert raw data into meaningful insights through reports, dashboards, and visualizations. Power BI consists of several basic components that work together to collect, analyze, and share data effectively.
Features of Power BI
1. Data Connectivity
- Power BI can connect to a wide range of data sources such as Excel, CSV files, SQL databases, cloud platforms, and web services.
- It allows users to combine and analyze data from multiple sources in one place.
2. Interactive Dashboards
- Power BI provides highly interactive dashboards with visual elements like charts, graphs, maps, and KPIs.
- Users can filter, drill down, and explore data dynamically.
3. Real-Time Data Refresh
- Power BI supports real-time and scheduled data updates.
- This ensures that users always work with the latest and most accurate data.
4. Drag-and-Drop Interface
- It offers a user-friendly interface where users can create reports easily without advanced programming skills.
- This makes it suitable for both technical and non-technical users.
5. Data Transformation (Power Query)
- Power BI includes Power Query to clean, transform, and prepare data before analysis.
- It allows handling missing values, removing duplicates, and reshaping data.
6. Data Modeling (Power Pivot)
- Power BI supports data modeling by creating relationships between tables and performing calculations using DAX.
- It helps in handling large datasets efficiently.
7. Cloud Integration
- Power BI integrates with Microsoft Azure and other cloud services.
- Reports can be shared online through Power BI Service.
Advantages of Power BI
1. Easy to Use
- Power BI has a simple and intuitive interface that makes it easy to learn and use.
- Even beginners can create reports and dashboards quickly.
2. Cost-Effective
- It offers a free desktop version and affordable subscription plans.
- This makes it suitable for small, medium, and large organizations.
3. Fast Performance
- Power BI provides fast data processing and visualization, even for large datasets.
- It supports in-memory analytics for better performance.
4. Real-Time Insights
- Users can monitor business performance in real time using live dashboards.
- This helps in quick decision-making.
5. Strong Integration
- Power BI works seamlessly with Microsoft tools like Excel, Azure, and SQL Server.
- It enhances productivity for organizations using Microsoft ecosystem.
6. Self-Service BI
- Business users can create their own reports without depending on IT teams.
- This reduces time and increases efficiency.
Limitations of Power BI
1. Learning DAX Can Be Complex
- Advanced calculations require knowledge of DAX (Data Analysis Expressions), which can be difficult for beginners.
2. Limited Customization in Free Version
- Some advanced features and sharing options are available only in paid versions.
3. Performance Issues with Very Large Data
- Handling extremely large datasets may affect performance without proper optimization.
4. Dependency on Microsoft Ecosystem
- Power BI works best with Microsoft tools, which may limit flexibility with non-Microsoft environments.
5. Data Size Limitations
- There are restrictions on dataset size in certain versions, which can limit usage for very large-scale applications.
Power BI architecture
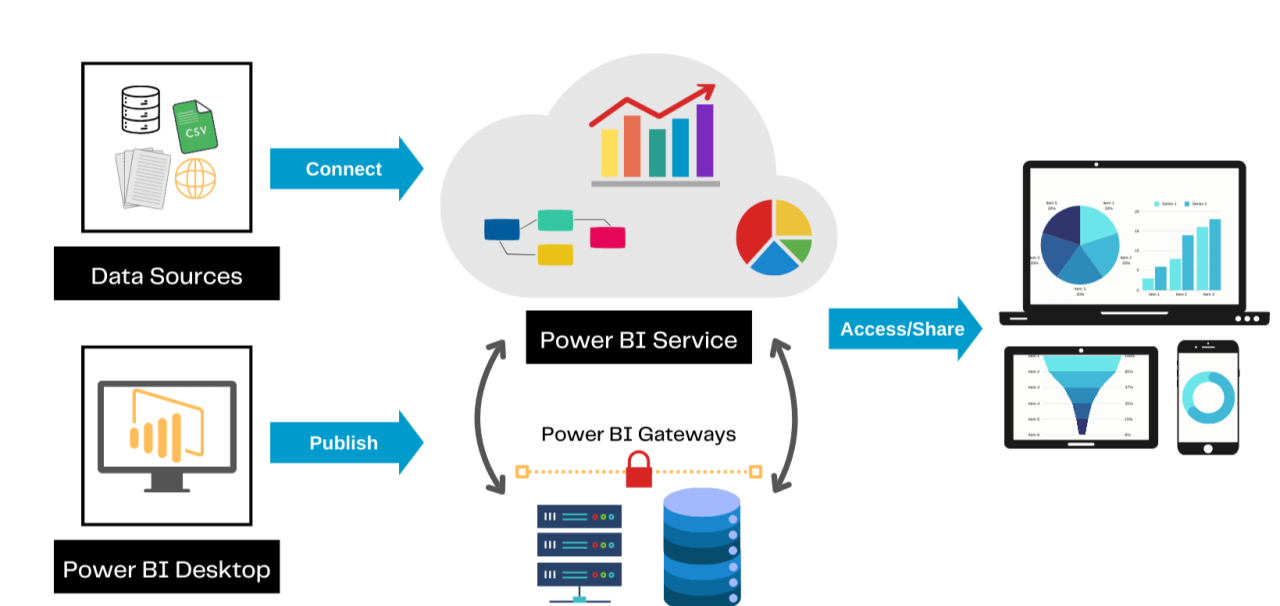
- Power BI architecture represents how data flows from different sources to visualization and decision-making.
- It includes data sources, data transformation, data modeling, and reporting layers that work together to generate insights.
Steps in Power BI Architecture
1. Data Sources
- Data is collected from various sources such as Excel files, databases (SQL Server, MySQL), cloud services (Azure), and web APIs.
- These sources provide raw data for analysis.
2. Data Transformation (Power Query)
- The collected data is cleaned and transformed using Power Query.
- It involves removing duplicates, handling missing values, changing data types, and shaping data.
3. Data Modeling (Power Pivot)
- After transformation, data is loaded into the data model.
- Relationships are created between tables, and calculations are performed using DAX.
- This step organizes data for efficient analysis.
4. Data Visualization (Power View)
- The processed data is visualized using charts, graphs, dashboards, and reports.
- Users can interact with visuals to explore insights.
5. Data Sharing (Power BI Service & Mobile)
- Reports and dashboards are published to Power BI Service (cloud).
- Users can access them through web browsers or Power BI Mobile apps.
Components of Power BI
- Power BI consists of several important components that work together to collect, transform, analyze, and visualize data.
- These components help convert raw data into meaningful insights for decision-making.
1. Power Query (Data Preparation & Transformation)
- Power Query is used to connect to different data sources such as Excel, databases, and web services.
- It helps in cleaning and transforming data by removing duplicates, handling missing values, and changing data formats.
- Users can also merge, split, and reshape data for better analysis.
- It ensures that data is accurate and ready before loading into the model.
2. Power Pivot (Data Modeling & Calculations)
- Power Pivot is the data modeling engine of Power BI.
- It is used to create relationships between multiple tables and manage large datasets efficiently.
- It allows users to perform advanced calculations using DAX (Data Analysis Expressions).
- This component helps in building a structured and optimized data model.
3. Power View (Data Visualization & Reporting)
- Power View is used to create interactive reports and dashboards.
- It supports visual elements such as charts, tables, maps, and graphs.
- Users can apply filters, slicers, and drill-down features to explore data easily.
- It helps in presenting data in a clear and understandable visual format.
4. Power Map (Geographical Visualization)
- Power Map is used for visualizing data on maps and in 3D format.
- It allows users to plot data based on geographic locations such as cities, countries, or regions.
- It supports features like heat maps, bubble maps, and time-based animations.
- This component is useful for analyzing location-based trends and patterns.
Platforms of Power BI
1. Power BI Desktop
- Power BI Desktop is a Windows-based application used to create reports and data models. It allows users to connect to different data sources, clean and transform data using Power Query, create relationships between tables, and design interactive reports. Most of the development work is done in Power BI Desktop before publishing reports to the Power BI Service.
2. Power BI Service
- Power BI Service is a cloud-based platform also known as Power BI Online. It is used to publish, share, and collaborate on reports and dashboards created in Power BI Desktop. Users can access reports through a web browser, schedule data refreshes, and control data access using security settings.
3. Power BI Mobile
- Power BI Mobile is a mobile application available for Android, iOS, and Windows devices. It allows users to view reports and dashboards anytime and anywhere. The mobile interface is optimized for smaller screens and helps users monitor key performance indicators and business metrics on the go.
Compare Traditional BI vs Power BI
| Feature | Traditional BI | Power BI |
|---|---|---|
| Architecture | Uses centralized, on-premises architecture managed by the IT department. | Uses modern cloud-based architecture built on Microsoft Azure with optional hybrid support. |
| Data Processing | Relies on complex ETL processes and OLAP cubes that require technical expertise. | Supports self-service data preparation with Power Query and in-memory analytics. |
| Cost | Requires high initial investment in hardware, software licenses, and maintenance. | Cost-effective with a free desktop version and low-cost subscription plans. |
| Usability | Has a steep learning curve and depends heavily on IT for report creation. | User-friendly interface with drag-and-drop features suitable for non-technical users. |
| Reporting | Mostly provides static or scheduled reports. | Provides interactive reports and real-time dashboards. |
| Performance | Slower insights due to batch processing and delayed updates. | Fast performance with real-time data refresh and efficient handling of large datasets. |
| Flexibility | Less flexible and difficult to modify reports quickly. | Highly flexible and allows quick changes and self-service analytics. |
| Deployment | Mainly on-premises deployment. | Cloud, on-premises, and hybrid deployment options available. |
| Scalability | Scaling requires additional infrastructure and cost. | Easily scalable through cloud resources. |
Differentiate: Power BI, Tableau, and QlikView
| Feature | Power BI | Tableau | QlikView |
|---|---|---|---|
| Developer | Power BI is developed by Microsoft and is strongly integrated with Microsoft products like Excel, Azure, and Microsoft 365. | Tableau is developed by Salesforce and is widely known for advanced data visualization capabilities. | QlikView is developed by Qlik and is based on an associative data model. |
| User Interface | Power BI has a simple and user-friendly interface suitable for both technical and non-technical users. | Tableau has a visually rich interface but requires some learning to master advanced features. | QlikView has a more technical interface and often requires scripting knowledge. |
| Data Visualization | Power BI provides interactive dashboards and standard visualizations for business reporting. | Tableau is highly powerful in visual storytelling and offers advanced and customizable visualizations. | QlikView focuses more on interactive davta exploration than detailed visual design. |
| Data Handling | Power BI supports real-time data analysis and handles large datasets efficiently. | Tableau handles large datasets well but may require performance optimization. | QlikView uses an associative data model that allows flexible and fast data exploration. |
| Cost | Power BI is cost-effective with a free desktop version and affordable subscription plans. | Tableau is relatively expensive, especially for enterprise use. | QlikView is costly and mainly used by large organizations. |
| Ease of Learning | Power BI is easy to learn, especially for users familiar with Microsoft tools. | Tableau has a moderate learning curve. | QlikView has a steep learning curve due to scripting requirements. |
| Suitable Use Case | Power BI is ideal for organizations using Microsoft-based systems. | Tableau is ideal for organizations focusing on advanced visual analytics. | QlikView is ideal for complex data analysis and associative exploration. |
| Example | A retail company uses Power BI to analyze sales data from Excel and SQL Server and create dashboards. | A marketing team uses Tableau to visualize campaign performance and customer trends. | A manufacturing company uses QlikView to analyze inventory, production, and supply chain data. |
Advantages of Power BI over Traditional BI
1. User-Friendly Interface
- Power BI provides a simple and intuitive drag-and-drop interface.
- Unlike traditional BI, it can be used easily by non-technical users without deep IT knowledge.
2. Real-Time Data Analysis
- Power BI supports real-time and live data updates.
- Traditional BI systems usually work on batch processing, which leads to delayed insights.
3. Cost-Effective Solution
- Power BI offers a free desktop version and affordable subscription plans.
- Traditional BI systems require expensive infrastructure, licenses, and maintenance.
4. Self-Service BI
- Power BI allows business users to create reports and dashboards independently.
- In traditional BI, users depend heavily on IT teams for report generation.
5. Interactive Visualizations
- Power BI provides highly interactive dashboards with filters, slicers, and drill-down features.
- Traditional BI mostly offers static reports with limited interactivity.
6. Easy Integration
- Power BI easily connects with multiple data sources such as Excel, SQL Server, and cloud platforms.
- Traditional BI systems often require complex integration processes.
7. Faster Performance and Deployment
- Power BI enables quick report creation and faster deployment.
- Traditional BI systems have longer development cycles and slower performance.
Process of Connecting Data Sources in Power BI Desktop
1. Open Power BI Desktop
- Launch the Power BI Desktop application on your system.
- The home screen provides options to connect to various data sources.
2. Select Get Data Option
- Click on the “Get Data” button available on the Home tab.
- A list of available data sources such as Excel, CSV, SQL Server, Web, and cloud services will appear.
3. Choose Data Source
- Select the required data source based on your data location.
- For example, choose Excel for spreadsheet data or SQL Server for database data.
4. Provide Connection Details
- Enter the required details such as file path, server name, database name, or URL.
- This step establishes a connection between Power BI and the data source.
5. Preview Data
- After connecting, Power BI displays a preview of the data in the Navigator window.
- You can select specific tables or sheets to load.
6. Transform Data (Power Query)
- Click on “Transform Data” to open Power Query Editor.
- Clean and prepare data by removing duplicates, handling missing values, and modifying columns.
7. Load Data
- After transformation, click on “Load” to import the data into Power BI.
- The data is then available for modeling and visualization.
8. Create Relationships (if needed)
- If multiple tables are loaded, relationships can be created between them.
- This helps in better analysis and report creation.
9. Start Visualization
- Once data is loaded, you can create charts, graphs, and dashboards using Power BI tools.