DWDM-01 Inroduction
On This Page
Data Mining
- Data mining is the process of discovering interesting patterns and knowledge from large amounts of data. The data sources can include databases, data warehouses, the Web, other information repositories, or data that are streamed into the system dynamically.
- Data mining is the process of discovering patterns, trends, and valuable insights from large datasets using statistical and computational techniques. It involves analyzing raw data to extract meaningful information that can be used for decision-making, predictive modelling, and understanding complex phenomena
Knowledge Discovery from Data (KDD)
- Data mining is considered as knowledge discovery from data, or KDD
- Data mining is also considered as merely an essential step in the process of knowledge discovery.
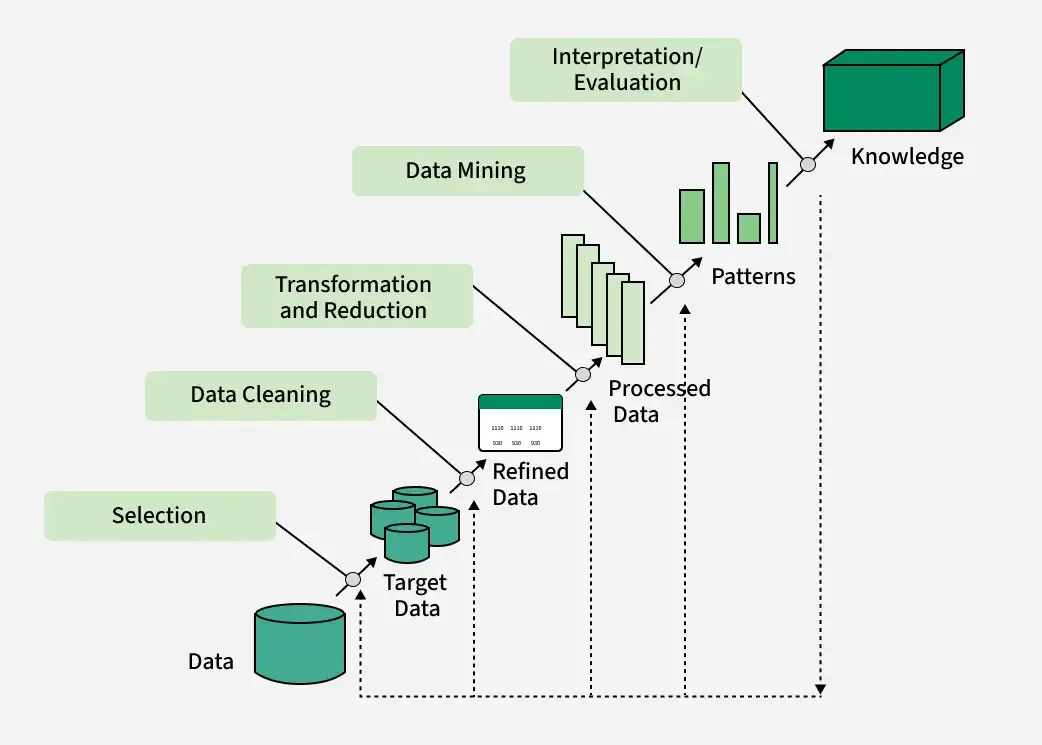
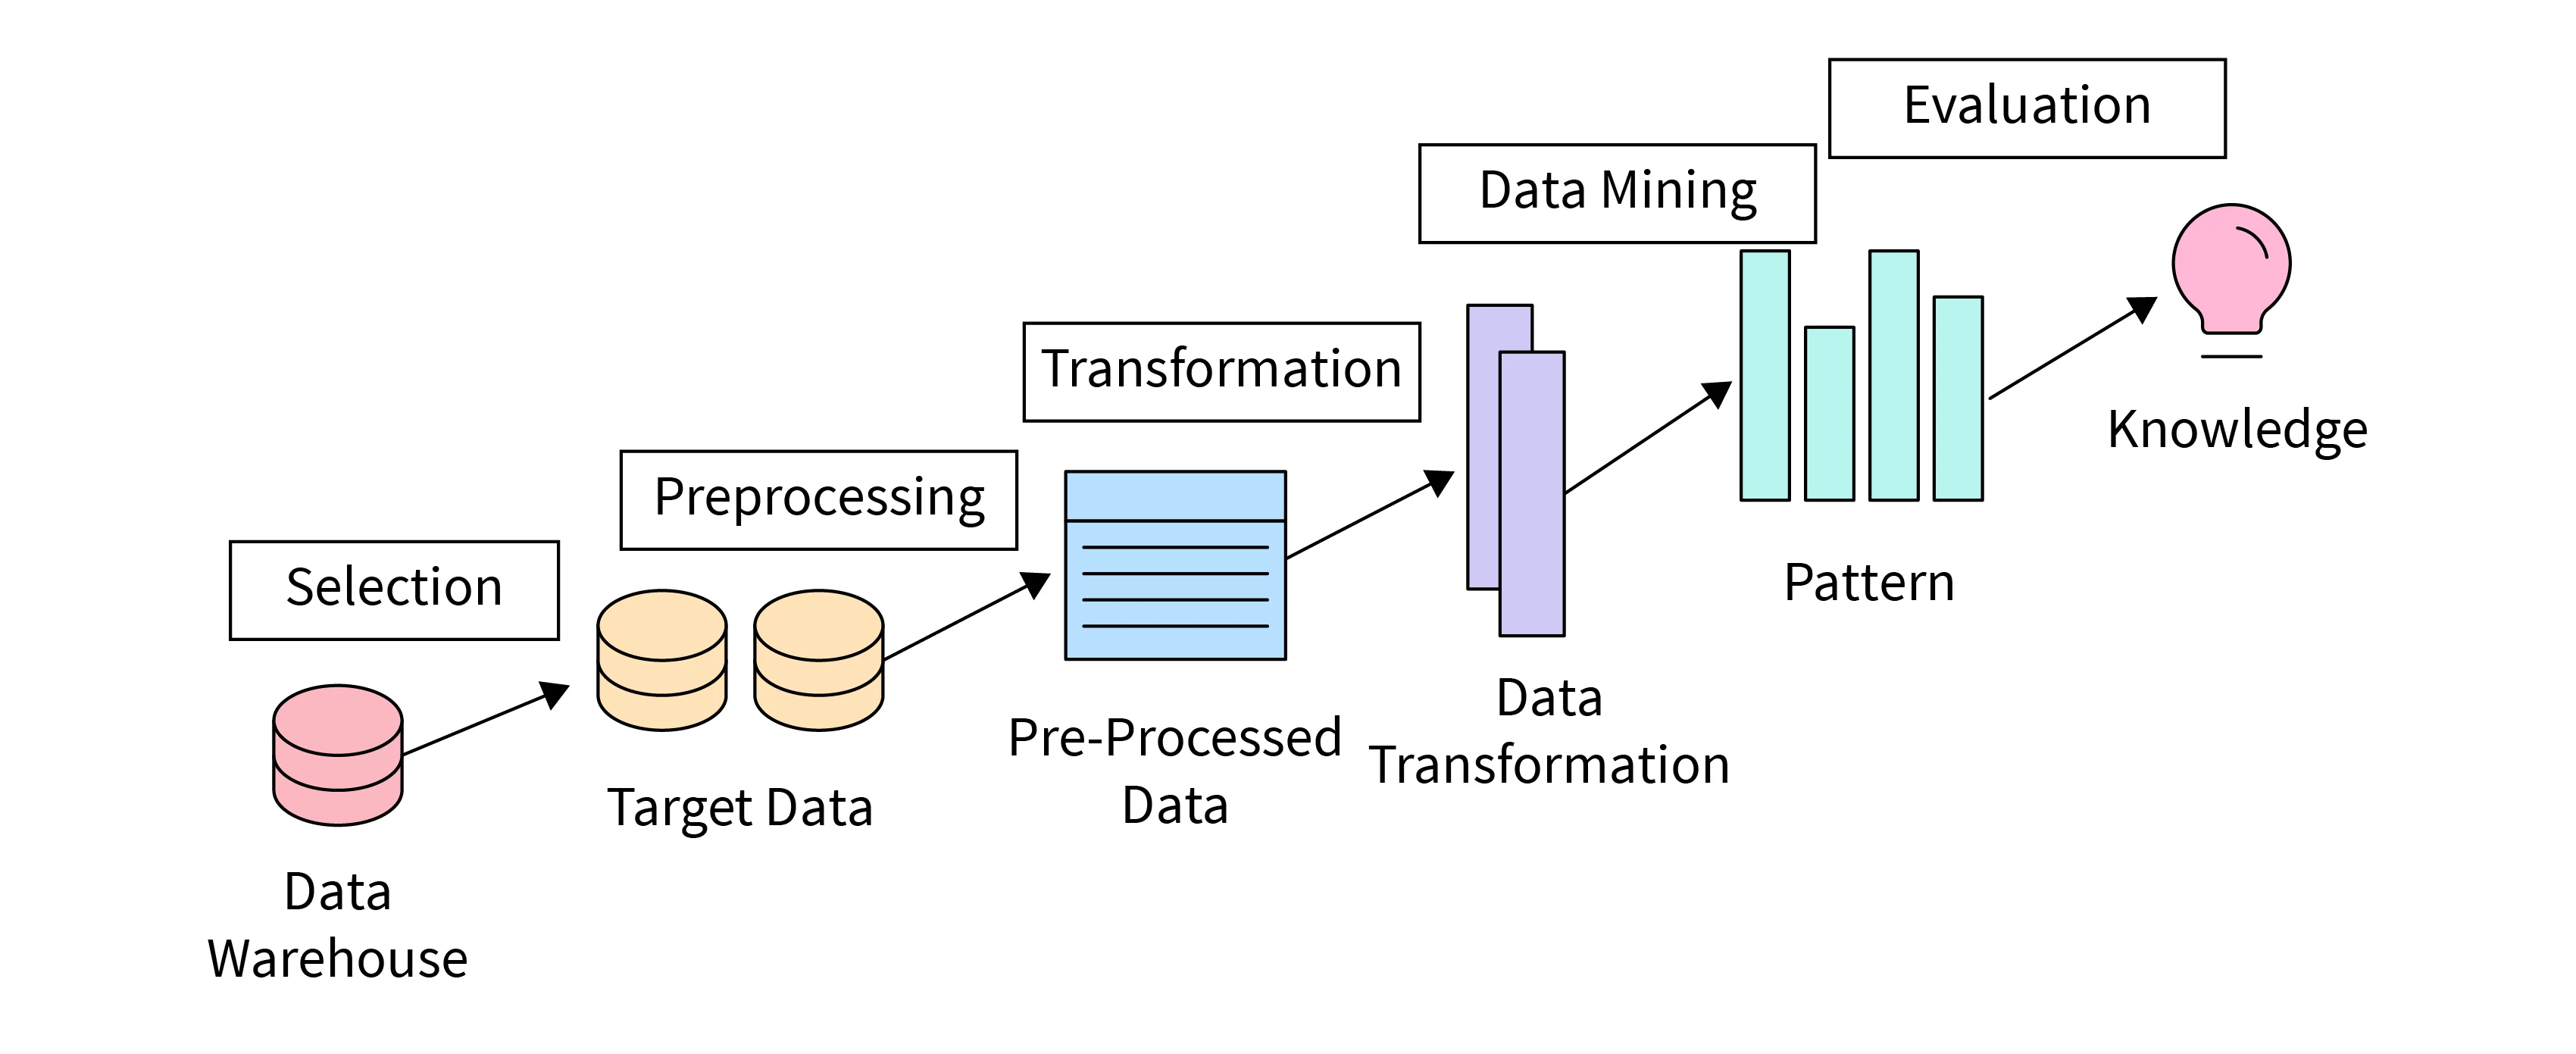
Knowledge Discovery Process
- Data cleaning (to remove noise and inconsistent data)
- Data integration (where multiple data sources may be combined)
- Data selection (where data relevant to the analysis task are retrieved from the database)
- Data transformation (where data are transformed and consolidated into forms appropriate for mining by performing summary or aggregation operations)
- Data mining (an essential process where intelligent methods are applied to extract data patterns)
- Pattern evaluation (to identify the truly interesting patterns representing knowledge based on interestingness measures)
- Knowledge presentation (where visualization and knowledge representation techniques are used to present mined knowledge to users)
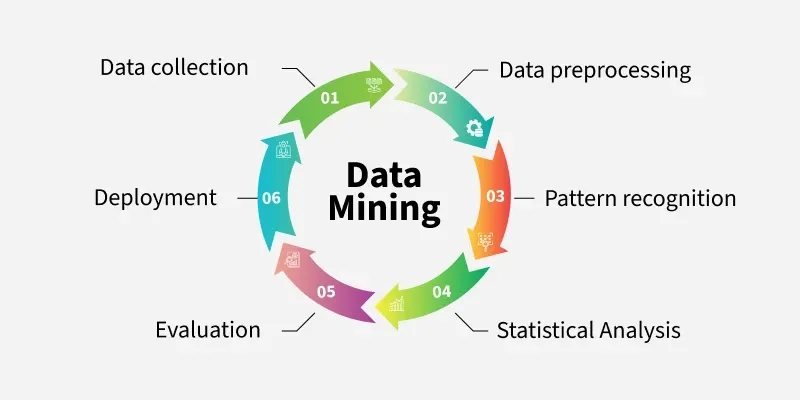
Work Flow of Data Mining
Types of Data Mining
What Kind of Data is Mined?
- Data mining can be applied to any kind of data as long as the data are meaningful for a target application.
- The most basic forms of data for mining applications are database data, data warehouse data, and transactional data.
Database Data
- A database system, also called a database management system (DBMS), consists of a collection of interrelated data, known as a database, and a set of software programs to manage and access the data.
- A relational database is a collection of tables, each of which is assigned a unique name. Each table consists of a set of attributes (columns or fields) and usually stores a large set of tuples (records or rows)
- When mining relational databases, we can go further by searching for trends or data patterns.
- For example, data mining systems can analyze customer data to predict the credit risk of new customers based on their income, age, and previous credit information.
- Data mining systems may also detect deviations—that is, items with sales that are far from those expected in comparison with the previous year. Such deviations can then be further investigated.
- For example, data mining may discover that there has been a change in packaging of an item or a significant increase in price.
- Relational databases are one of the most commonly available and richest information repositories, and thus they are a major data form in the study of data mining
Data Warehouse
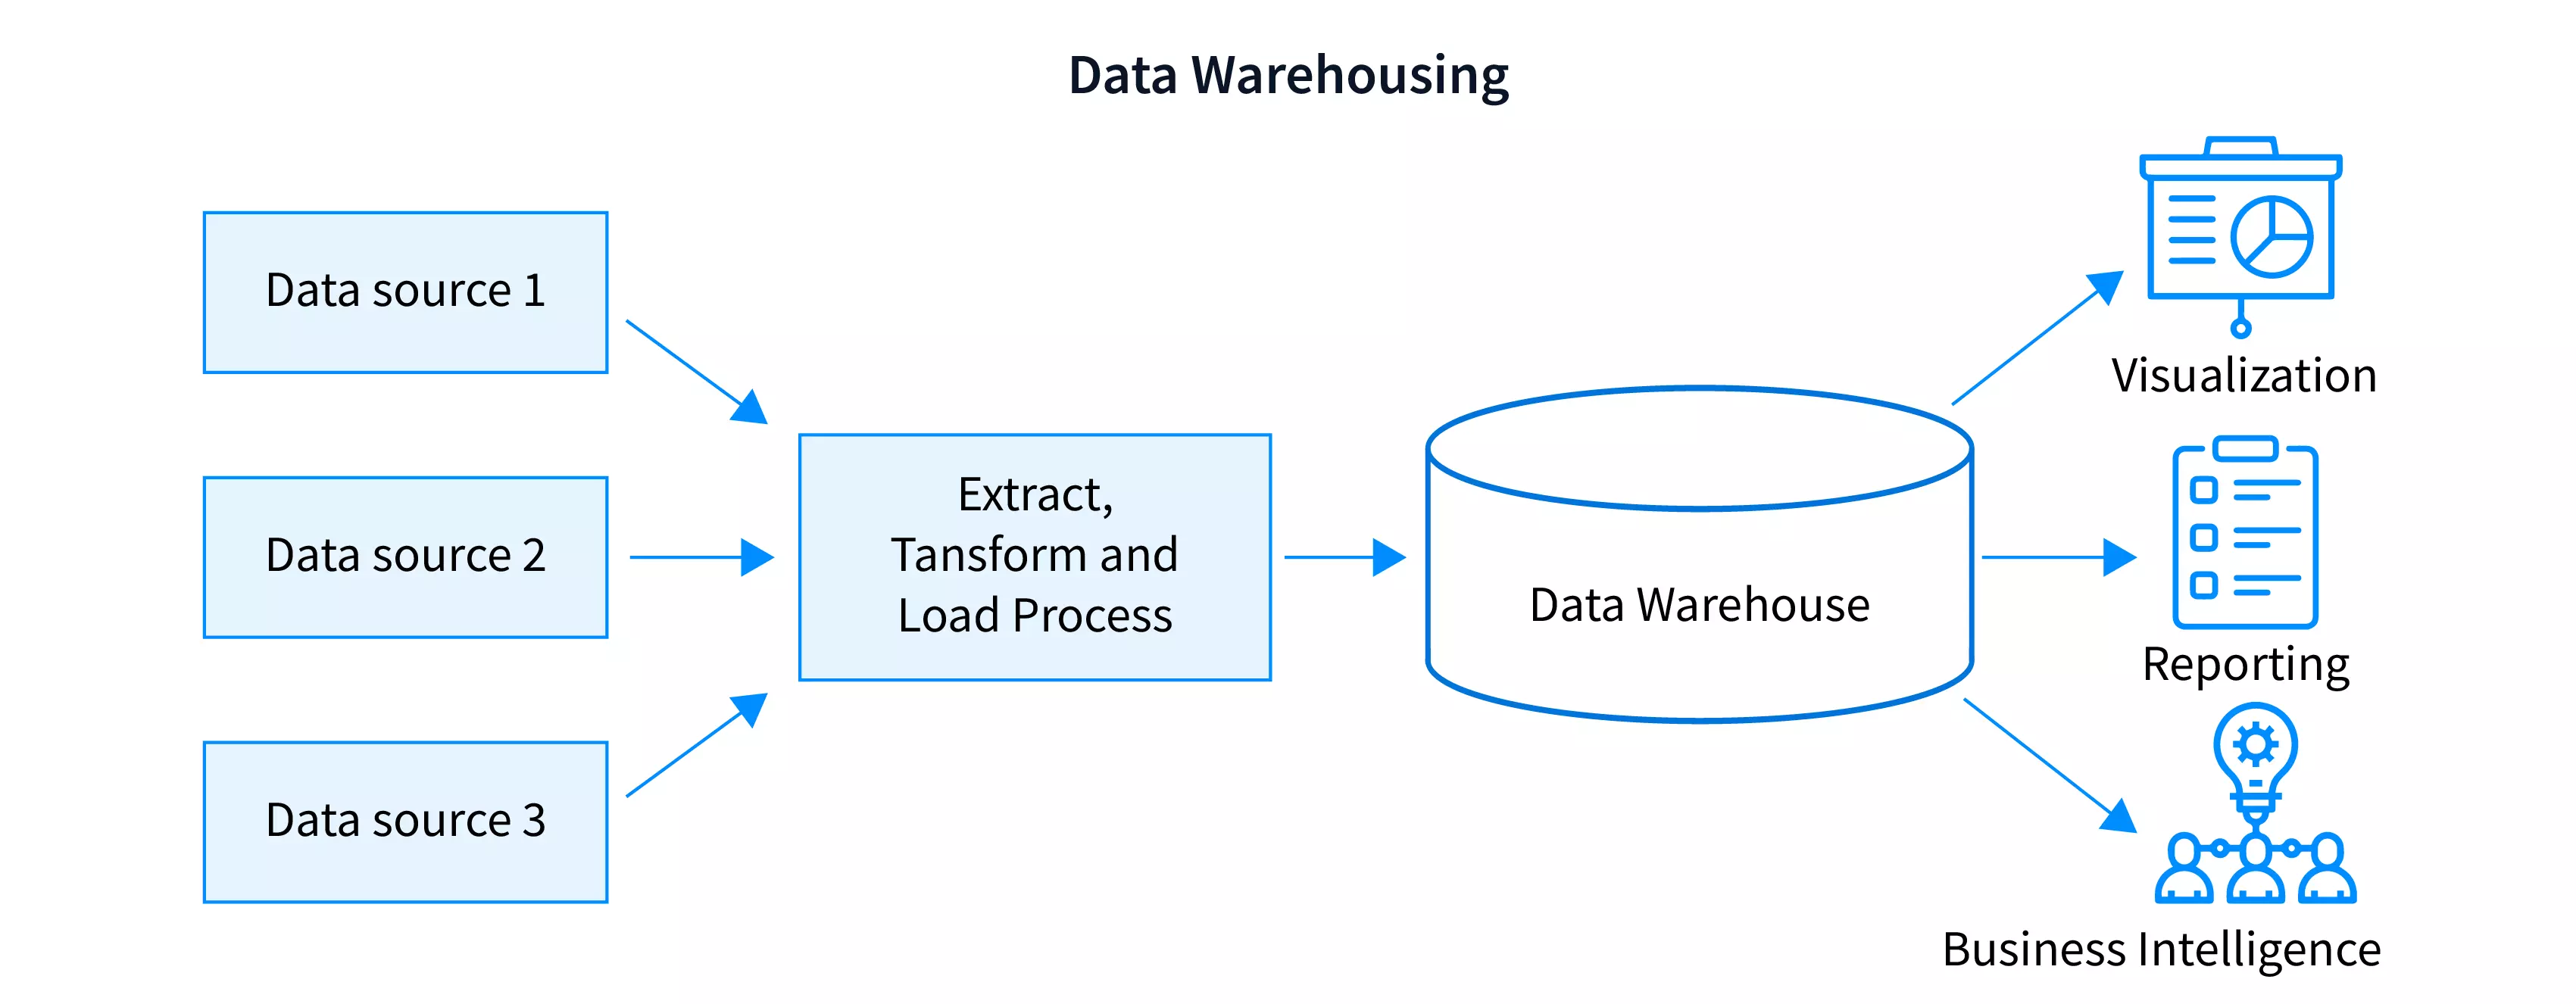
- A data warehouse is a repository of information collected from multiple sources, stored under a unified schema, and usually residing at a single site.
- Data warehouses are constructed via a process of data cleaning, data integration, data transformation, data loading, and periodic data refreshing.
- To facilitate decision making, the data in a data warehouse are organized around major subjects (e.g., customer, item, supplier, and activity).
- The data are stored to provide information from a historical perspective, such as in the past 6 to 12 months, and are typically summarized.
- For example, rather than storing the details of each sales transaction, the data warehouse may store a summary of the transactions per item type for each store or, summarized to a higher level, for each sales region.
- A data warehouse is usually modeled by a multidimensional data structure, called a data cube, in which each dimension corresponds to an attribute or a set of attributes in the schema, and each cell stores the value of some aggregate measure such as count
Framework of Data Warehouse
Transactional Data
- In general, each record in a transactional database captures a transaction, such as a customer’s purchase, a flight booking, or a user’s clicks on a web page.
- A transaction typically includes a unique transaction identity number (trans ID) and a list of the items making up the transaction, such as the items purchased in the transaction.
- A transactional database may have additional tables, which contain other information related to the transactions, such as item description, information about the salesperson or the branch, and so on
| Trans ID | list_of_items_IDs |
|---|---|
| T100 | 11, 13, 18, 116 |
| T200 | 12, 18 |
| ... | ... |
- Transactions can be stored in a table, with one record per transaction.
- The transactional database is usually either stored in a flat file in a format similar to the table in Figure above
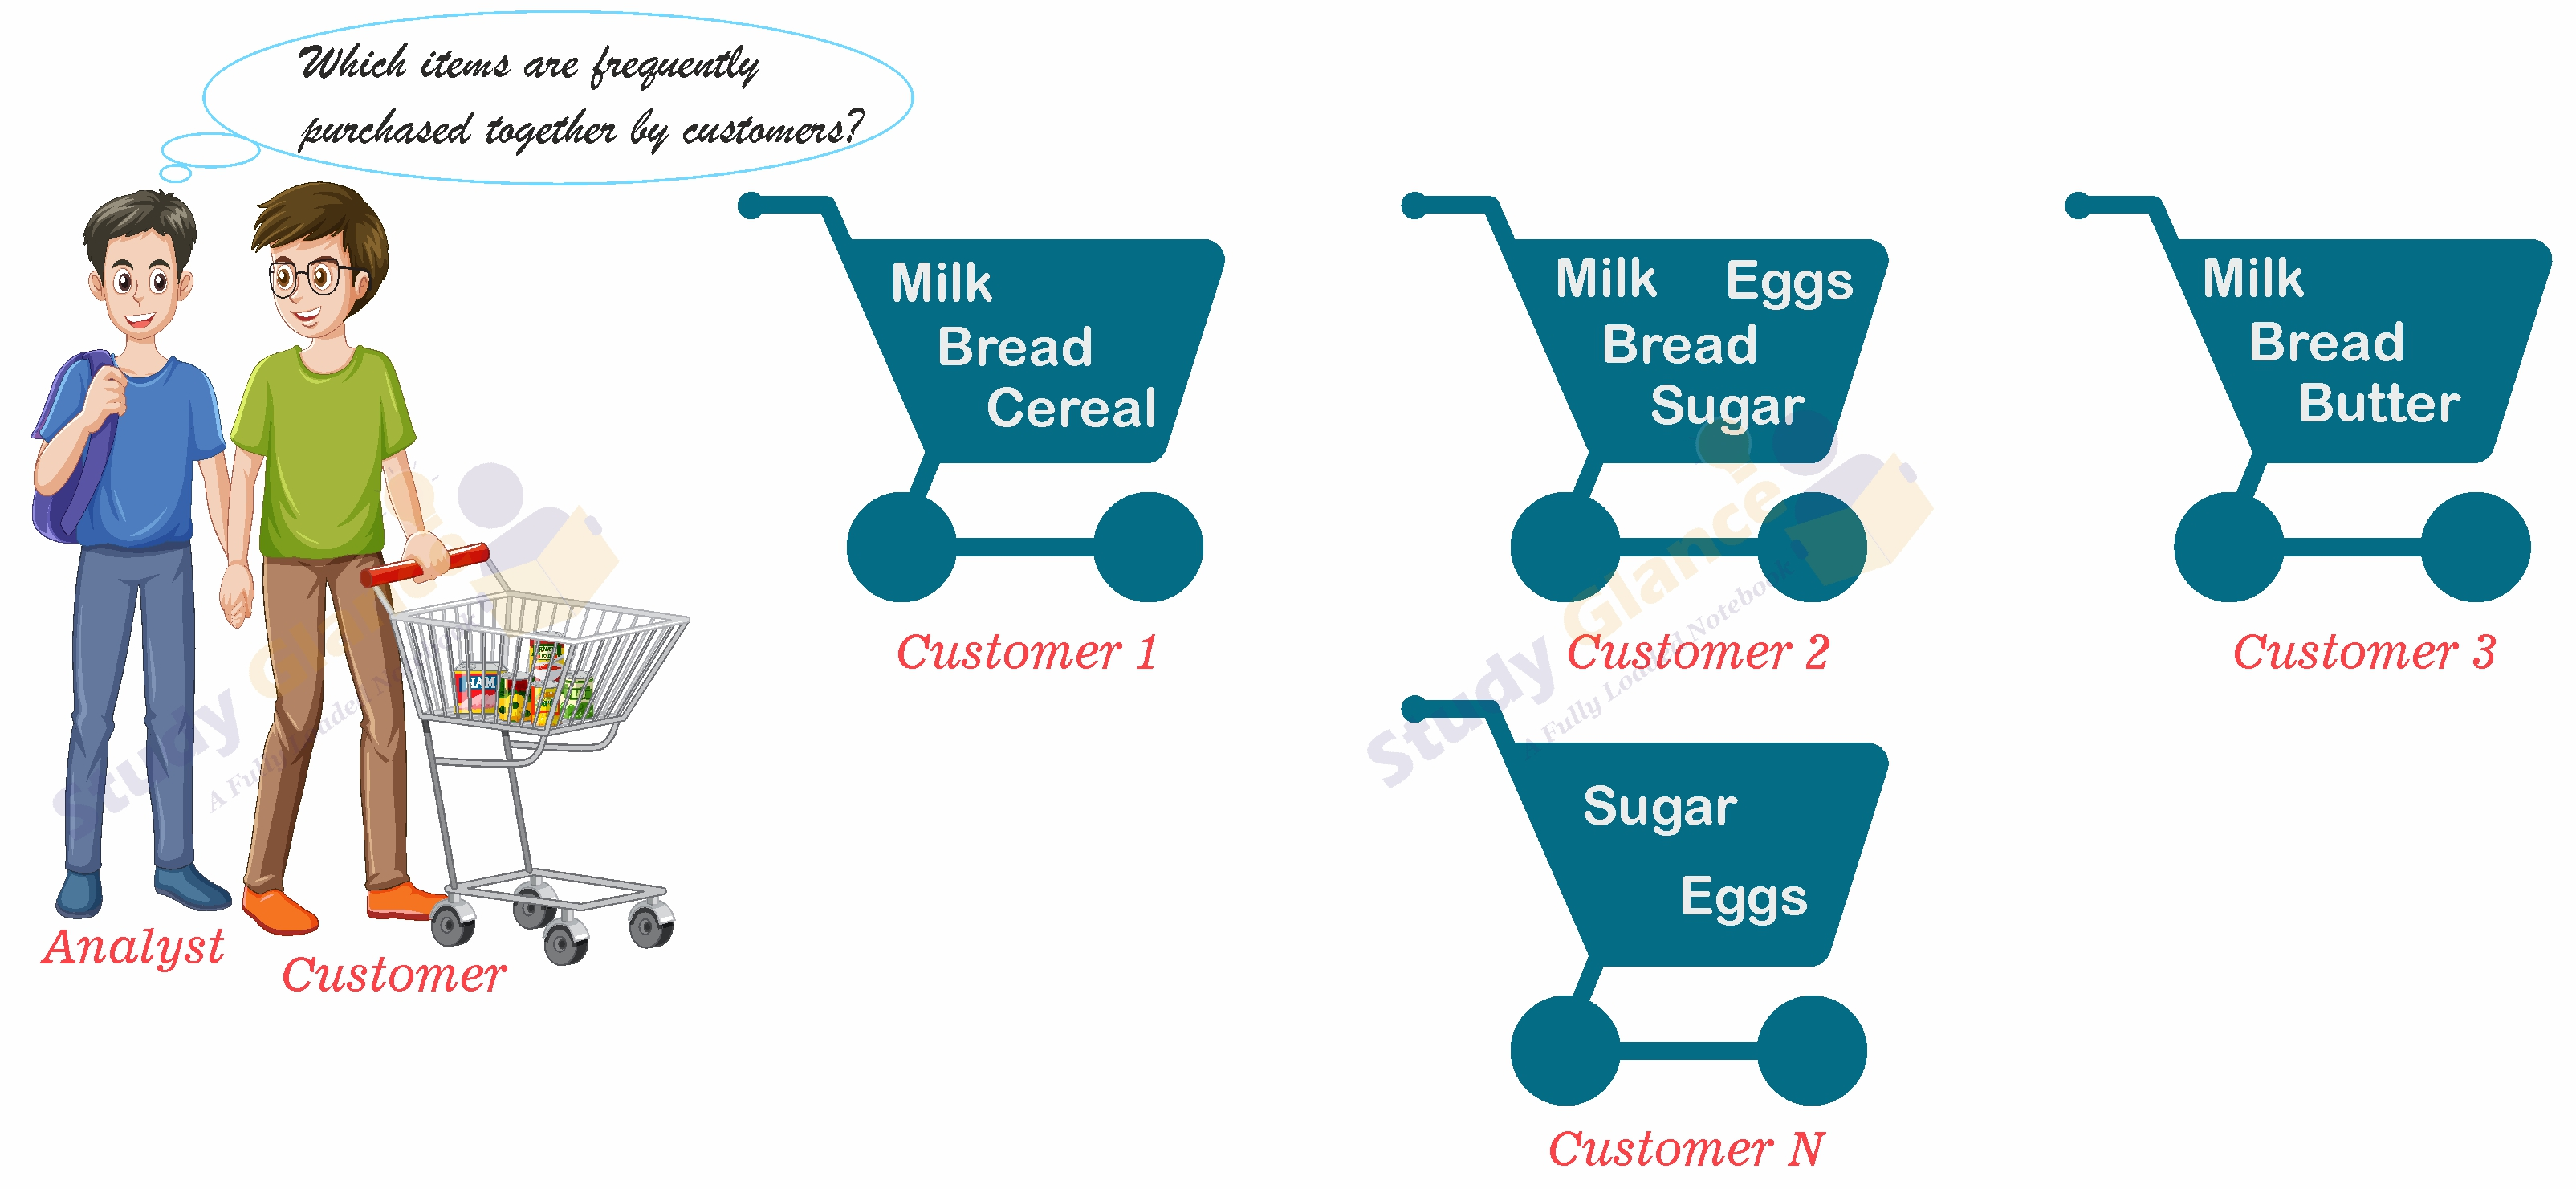
- “Which items sold well together?”
- This kind of market basket data analysis would enable you to bundle groups of items together as a strategy for boosting sales.
- For example, given the knowledge that printers are commonly purchased together with computers, you could offer certain printers at a steep discount (or even for free) to customers buying selected computers, in the hopes of selling more computers (which are often more expensive than printers).
- A traditional database system is not able to perform market basket data analysis.
- Fortunately, data mining on transactional data can do so by mining frequent item sets, that is, set
Other Kinds of Data
- Besides relational database data, data warehouse data, and transaction data, there are many other kinds of data that have versatile forms and structures.
- Such kinds of data can be seen in many applications:
- Time-related or sequence data (e.g., historical records, stock exchange data, time-series and biological sequence data)
- Data streams (e.g., video surveillance and sensor data, which are continuously transmitted)
- Spatial data (e.g., maps)
- Engineering design data (e.g., the design of buildings, system components, or integrated circuits)
- Hypertext and multimedia data (including text, image, video, and audio data)
- Graph and networked data(e.g., social and information networks)
- The Web (a huge, widely distributed information repository made available by the Internet).
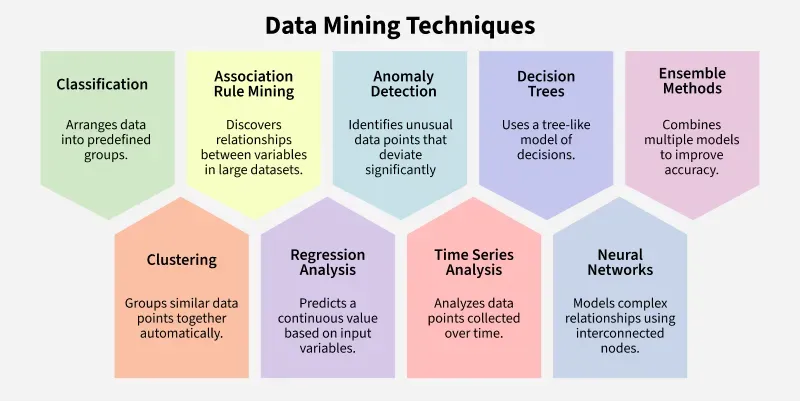
What Kind of Patterns can be Mined?
- There are a number of data mining functionalities.
- These include:
- Characterization and discrimination
- The mining of frequent patterns, associations and correlations
- Classification and regression
- Clustering analysis
- Outlier analysis.
- Data mining functionalities are used to specify the kinds of patterns to be found in data mining tasks.
Association Rule Mining
Clustering
Classification
Regression
- Regression is a supervised learning technique used to predict a continuous output value based on input features.
What Kind of Patterns can be Mined?
- In general, such tasks can be classified into two categories:
- Descriptive mining tasks characterize properties of the data in a target data set.
- Predictive mining tasks perform induction on the current data in order to make predictions
Class/Concept Description
-
Data entries can be associated with classes or concepts.
-
For example, in the any Electronics store, classes of items for sale include computers and printers, and concepts of customers include
bigSpendersandbudgetSpenders. -
Such descriptions of a class or a concept are called class/concept descriptions.
-
These descriptions can be derived using
- Data characterization, by summarizing the data of the class under study (often called the target class) in general terms,
- Data discrimination, by comparison of the target class with one or a set of comparative classes (often called the contrasting classes),
- both data characterization and discrimination
-
Data characterization is a summarization of the general characteristics or features of a target class of data.
-
The data corresponding to the user-specified class are typically collected by a query.
-
For example, to study the characteristics of software products with sales that increased by 10% in the previous year, the data related to such products can be collected by executing an SQL query on the sales database.
Data Characterization
-
Data characterization in data mining involves summarizing the general features of a target class of data.
-
It provides a descriptive overview of the data, often using statistical measures and visualizations like charts and graphs.
-
This process helps in understanding the key characteristics of a specific group of data, preparing it for further analysis or decision-making.
-
Example: Imagine a customer relationship manager wants to understand the characteristics of high spending customers at a retail store. Data characterization would involve summarizing the general features of these customers, such as their age range, occupation, income level, and purchase history. This summarized information would then be presented in a report or visualization, providing a clear profile of the high-spending customer segment
-
In essence, data characterization is the first step in understanding data, providing a concise and informative overview before more complex analysis is undertaken.
Key Aspects of Data Characterization
- Summarization: Data characterization aims to condense and summarize the main attributes and characteristics of a data set or a specific class within that data.
- Target Class: It focuses on a particular group of data that is of interest to the user, like customers who spend a certain amount or products with specific features.
- Statistical Measures: Characterization often involves using statistical methods like mean, median, mode, standard deviation, and frequency distributions to describe the data.
- Visualizations: Graphs, charts, and multidimensional data cubes are commonly used to present the summarized data in an understandable format.
Data Discrimination
- Data discrimination is a comparison of the general features of the target class data objects against the general features of objects from one or multiple contrasting classes
- The target and contrasting classes can be specified by a user, and the corresponding data objects can be retrieved through database queries.
- For example, a user may want to compare the general features of software products with sales that increased by 10% last year against those with sales that decreased by at least 30% during the same period.
- The methods used for data discrimination are similar to those used for data characterization
- "How are discrimination descriptions output?”
- The forms of output presentation are similar to those for characteristic descriptions, although discrimination descriptions should include comparative measures that help to distinguish between the target and contrasting classes.
- Discrimination descriptions expressed in the form of rules are referred to as discriminant rules
Mining Frequent Patterns, Associations, & Correlation
- Frequent patterns, as the name suggests, are patterns that occur frequently in data.
- There are many kinds of frequent patterns, including frequent
itemsets, frequentsub_sequences(also known as sequential patterns), and frequent substructures. - A frequent itemset typically refers to a set of items that often appear together in a transactional data set—for example, milk and bread, which are frequently bought together in grocery stores by many customers.
Frequent Item-sets
- A frequent itemset typically refers to a set of items that often appear together in a transactional data set—for example, milk and bread, which are frequently bought together in grocery stores by many customers.
Frequent Sub-Sequence
- A frequently occurring subsequence, such as the pattern that customers, tend to purchase first a laptop, followed by a digital camera, and then a memory card, is a (frequent) sequential pattern.
Frequent Sub-Structures
- A substructure can refer to different structural forms (e.g., graphs, trees, or lattices) that may be combined with itemset or subsequence.
- If a substructure occurs frequently, it is called a (frequent) structured pattern.
- Mining frequent patterns leads to the discovery of interesting associations and correlations within data.
Classification & Regression for Predictive Analysis
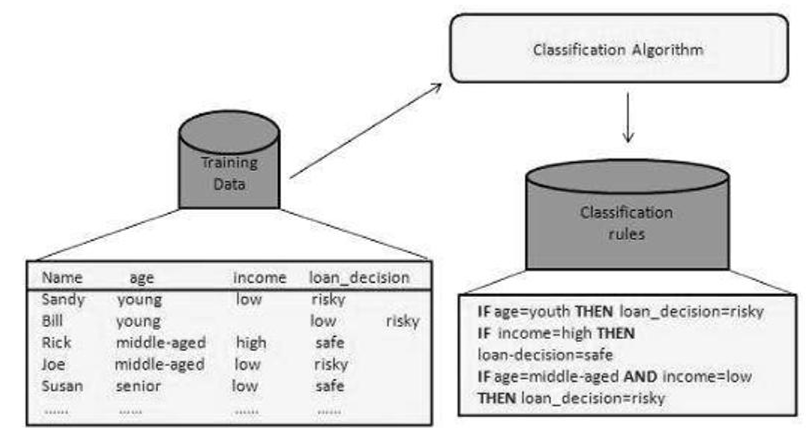
- Classification is the process of finding a model (or function) that describes and distinguishes data classes or concepts.
- The model are derived based on the analysis of a set of training data (i.e., data objects for which the class labels are known).
- The model is used to predict the class label of objects for which the the class label is unknown.
- "How is the derived model presented?”
- The derived model may be represented in various forms, such as classification rules (i.e., IF-THEN rules), decision trees, mathematical formulae, or neural networks.
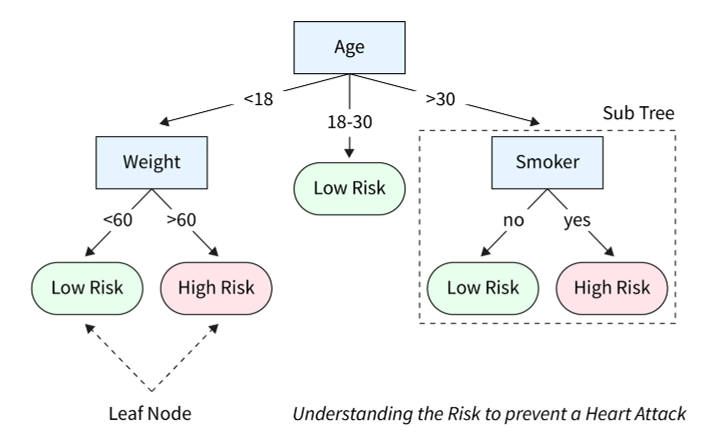
- A decision tree is a flowchart-like tree structure, where each node denotes a test on an attribute value, each branch represents an outcome of the test, and tree leaves represent classes or class distributions.
Decision Tree
- A decision tree is a flowchart-like tree structure, where each node denotes a test on an attribute value, each branch represents an outcome of the test, and tree leaves represent classes or class distributions.
- Decision trees can easily e converted to classification rules.
Neural Network
- A neural network, when used for classification, is typically a collection of neuron-like processing units with weighted connections between the units.
- There are many other methods for constructing classification models, such as naïve Bayesian classification, support vector machines, and k nearest-neighbour classification.
Regression
- Whereas classification predicts categorical (discrete, unordered) labels, regression models continuous-valued functions
- That is, regression is used to predict missing or unavailable numerical data values rather than (discrete) class labels.
- The term prediction refers to both numeric prediction and class label prediction.
- Regression analysis is a statistical methodology that is most often used for numeric prediction, although other
- Methods exist as well. Regression also encompasses the identification of distribution trends based on the available data.
Cluster Analysis
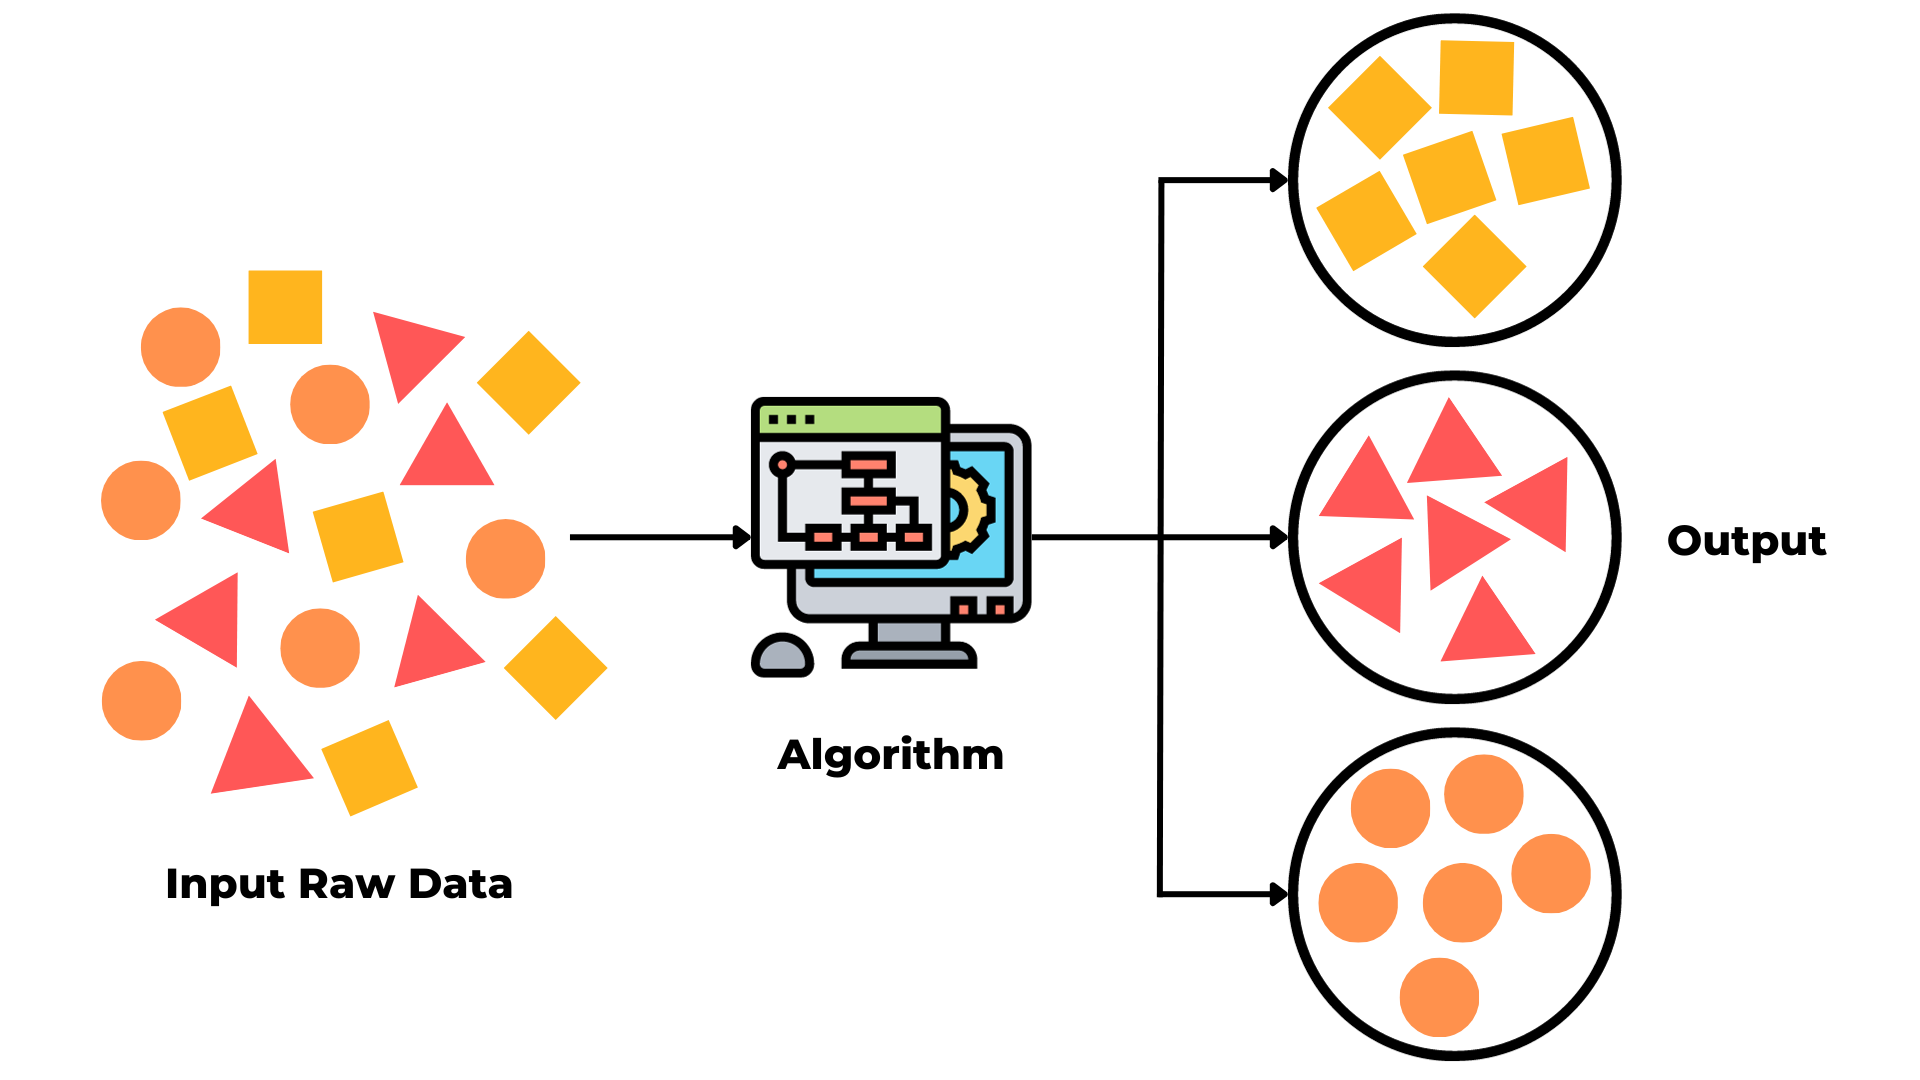
- Clustering analyzes data objects without consulting class labels.
- In many cases,
class_x0002_labeleddata may simply not exist at the beginning. - Clustering can be used to generate class labels for a group of data.
- The objects are clustered or grouped based on the principle of maximizing the intraclass similarity and minimizing the interclass similarity
Clustering
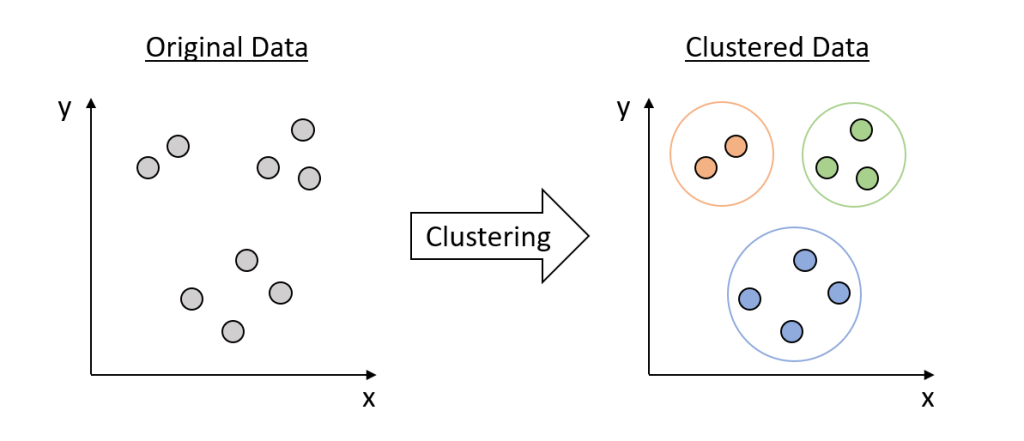
- That is, clusters of objects are formed so that objects within a cluster have high similarity in comparison to one another, but are rather dissimilar to objects in other clusters.
- Each cluster so formed can be viewed as a class of objects, from which rules can be derived.
Application of KDD
Business & Marketing:
- Customer Segmentation: KDD helps businesses understand customer behaviour and preferences by analyzing purchase history, demographics, and online activity, allowing for targeted marketing campaigns.
- Market Basket Analysis: Identifying products that are frequently purchased together (e.g., diapers and beer) to optimize product placement and promotions.
- Sales Forecasting: Predicting future sales trends based on historical data to improve inventory management and resource allocation.
- Customer Relationship Management (CRM): Using KDD to personalize customer interactions, improve customer service, and enhance overall customer satisfaction.
Finance:
- Fraud Detection: Identifying fraudulent transactions in credit card usage, banking, and insurance by spotting unusual patterns or anomalies.
- Credit Risk Assessment: Evaluating the credit worthiness of loan applicants based on their financial history and other relevant data.
- Stock Market Analysis: Predicting stock price movements and identifying potential investment opportunities.
Healthcare:
- Disease Diagnosis: Analyzing patient data to identify potential diseases and predict patient outcomes.
- Drug Discovery: Identifying potential drug candidates and predicting their effectiveness by analyzing biological data.
- Patient Monitoring: Tracking patient health vitals and alerting medical professionals to potential issues.
- Personalized Treatment Plans: Tailoring treatment plans based on individual patient characteristics and response to previous treatments.
Scientific Research:
- Astronomy: Classifying celestial objects and analyzing large astronomical datasets.
- Genomics: Identifying genetic patterns and predicting disease risks.
- Climate Science: Analyzing climate data to understand climate change and predict future climate patterns.
Other Applications
-
Manufacturing: Optimizing production processes, identifying defects, and improving quality control.
-
Education: Analyzing student performance data to improve teaching methods and identify at-risk students.
-
Fraud Detection in Telecom: Detecting fraudulent activities in telecommunications networks.
-
Anomaly Detection in Networks: Identifying unusual network traffic patterns that may indicate security breaches or other issues.
-
Recommendation Systems: Recommending products, movies, or other content based on user preferences.
-
The KDD process, which involves data selection, pre-processing, transformation, mining, pattern evaluation, and knowledge representation, is a core component of these applications.
-
By effectively extracting and interpreting knowledge from data, KDD enables organizations to make better decisions, improve efficiency, and gain a competitive advantage
Questions
- What is Data Mining? Explain its significance in discovering useful patterns from large datasets.
- What kinds of data can be mined? Describe with examples (Database data, Data Warehouses, Transactional data, and other types).
- What are the different types of patterns that can be mined in data mining?
- Explain the steps involved in the Knowledge Discovery in Databases (KDD) process with a neat diagram.
- Give two real-life applications of KDD in business intelligence, healthcare, or marketing, explaining how data mining is used.