DWDM-02 Data Pre-processing
On This Page
Why Pre-process the Data?
- Data have quality if they satisfy the requirements of the intended use.
- There are many factors comprising data quality, including: Accuracy, Completeness, Consistency Timeliness, Believability, Interpretability.
- The data you wish to analyse by data mining techniques are:
- Incomplete (lacking attribute values or certain attributes of interest, or containing only aggregate data)
- Inaccurate or noisy (containing errors, or values that deviate from the expected); and
- Inconsistent (e.g., containing discrepancies in the department codes used to categorize items).
- Inaccurate, incomplete, and inconsistent data are
common_placeproperties of large real-world databases and data warehouses. - Incorrect Data: Incorrect attribute values
- Reasons:
- The data collection instruments used may be faulty.
- There may have been human errors occurring at data entry
- Users may purposely submit incorrect data values for mandatory fields when they do not wish to submit personal information
- Errors in data transmission can also occur. There may be technology limitations such as limited buffer size for coordinating synchronized data transfer and consumption.
- Incorrect data may also result from inconsistencies in naming conventions or data codes, or inconsistent formats for input fields (e.g., date).
- Duplicate tuples also require data cleaning.
- Reasons:
Major Tasks in Data Cleaning
- Data Cleaning: Fill in the missing value, smooth noisy data, identify or remove outliers, and resolve inconsistencies.
- Data Integration: Integration of multiple databases, data cubes or files
- Data Transformation: Normalization and Aggregation
- Data Reduction: Obtains reduced representation in volume but produces the same or similar analytical results.
- Data Discretization: Part of data reduction but with particular importance especially for numeric data
Data Cleaning
- Dirty data can cause confusion for the mining procedure, resulting in unreliable output.
- Therefore useful pre-processing step is to run your data through some data cleaning routines.
- Data Cleaning routines work to “clean” the data by:
- Filling in missing values,
- Smoothing noisy data,
- Identifying or removing outlier and
- Resolving inconsistencies.
- Real-world data tend to be incomplete, noisy, and inconsistent.
Missing Values
- Imagine that you need to analyse all Electronics sales and customer data.
- You note that many tuples have no recorded value for several attributes such as customer income.
- How can you go about filling in the missing values for this attribute?
- Ignore the tuple:
- This is usually done when the class label is missing (assuming the mining task involves classification)
- This method is not very effective, unless the tuple contains several attributes with missing values.
- Fill in the missing value manually:
- This approach is time consuming and may not be feasible given a large data set with many missing values.
- Use a global constant to fill in the missing value:
- Replace all missing attribute values by the same constant such as a label like “
Unknown” or−∞. - But, if missing values are replaced by, say, “Unknown,” then the mining program may mistakenly think that they form an interesting concept, since they all have a value in common—that of “Unknown”.
- Although this method is simple, it is not fool proof
- Replace all missing attribute values by the same constant such as a label like “
- Use a measure of central tendency for the attribute (e.g., the mean or median) to fill in the missing value:
- For normal (symmetric) data distributions, the mean can be used, while skewed data distribution should employ the median.
- Normal data forms a symmetrical, bell-shaped curve, where the mean, median, and mode are all equal and situated at the center.
- Skewed data, on the other hand, is asymmetrical, with one "tail" extending further than the other, indicating a non-equal distribution around the center
- Use the most probable value to fill in the missing value:
- This may be determined with regression, inference- based tools using a Bayesian formalism, or decision tree.
- Use the attribute mean or median for all samples belonging to the same class as the given tuple:
- For example, if classifying customers according to credit risk, we may replace the missing value with the mean income value for customers in the same credit risk category as that of the given tuple. If the data distribution for a given class is skewed, the median value is a better choice.
- Ignore the tuple:
Noisy Data
- Noise: Random error or variance in a measured variable
- Incorrect attribute values may be due to:
- Faulty data collection instruments
- Data entry problem
- Data Transmission Problem
- Technology limitation
- Inconsistency in naming convention (H.Shree, HShree)
How to Handle Noisy Data?
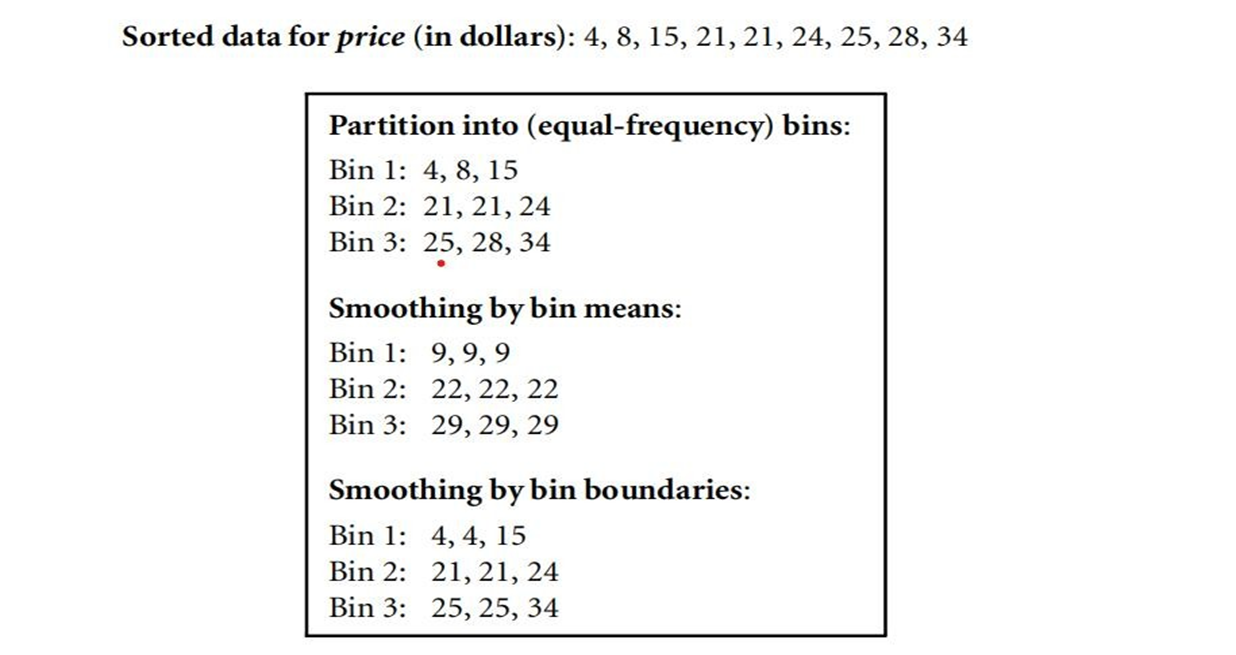
- Binning:
- Binning methods smooth a sorted data value by consulting its “neighborhood,” that is, the values around it.
- The sorted values are distributed into a number of “buckets,” or bins.
- Various methods for binning are smooth by bin means, smooth by bin median, smooth by bin boundaries etc.
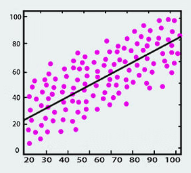
- Regression: Smooth by fitting the data into regression function
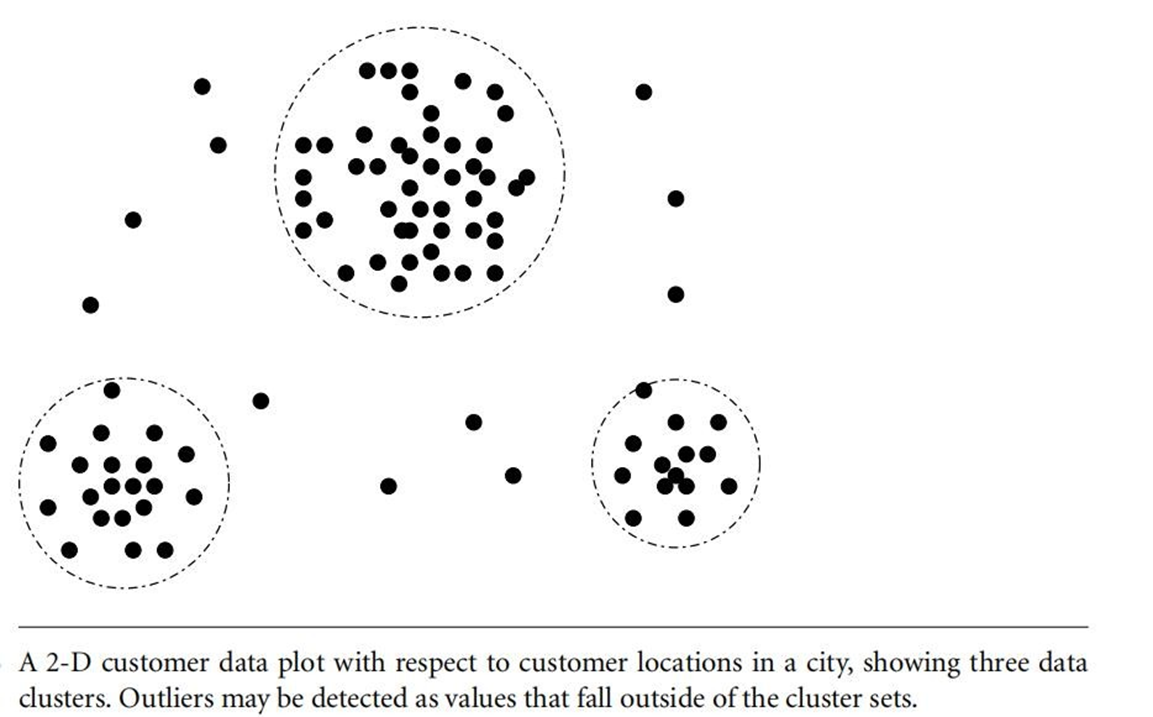
- Clustering: Detect and remove outliers
- Combined computer and Human inspection: Detect suspicious values and check by human
Other data problems which requires data cleaning:
- Duplicate records (omit Duplicate)
- Incomplete data
- Inconsistent Data(Decide which one is correct)
Steps in Data Cleaning
Discrepancy Detection:
- The first step in data cleaning as a process is discrepancy detection.
- Discrepancies can be caused by several factors, including
- Poorly designed data entry forms that have many optional fields
- Human error in data entry
- Deliberate errors (e.g., respondents not wanting to divulge information about themselves)
- Data decay (e.g., outdated addresses)
- Discrepancies may also arise from inconsistent data representations and inconsistent use of codes.
- Other sources of discrepancies include errors in instrumentation devices that record data and system errors.
- Errors can also occur when the data are (inadequately) used for purposes other than originally intended.
- There may also be inconsistencies due to data integration (e.g., where a given attribute can have different names in different databases).
How to Handle Data Discrepancy
- Use Metadata:
- As a starting point, use any knowledge you may already have regarding properties of the data.
- For example, what are the data type and domain of each attribute?
- What are the acceptable values for each attribute?
- Grasp data trends and identify anomalies.
- For example, find the mean, median, and mode values.
- Are the data symmetric or skewed?
- What is the range of values? Do all values fall within the expected range?
- What is the standard deviation of each attribute?
- Check Uniqueness Rule, consecutive rule and Null Rule:
- Uniqueness Rule: A unique rule says that each value of the given attribute must be different from all other values for that attribute
- Consecutive Rule: A consecutive rule says that there can be no missing values between the lowest and highest values for the attribute, and that all values must also be unique (e.g., as in check numbers).
- Null Rule: A null rule specifies the use of blanks, question marks, special characters, or other strings that may indicate the null condition (e.g., where a value for a given attribute is not available), and how such values should be handled.
Tools for Discrepancy Detection
- Data scrubbing tools: It use simple domain knowledge (e.g., knowledge of postal addresses and spell-checking) to detect errors and make corrections in the data.
- These tools rely on parsing and fuzzy matching techniques when cleaning data from multiple sources.
- Data auditing tools: It find discrepancies by analyzing the data to discover rules and relationships, and detecting data that violate such conditions.
- They are variants of data mining tools.
- For example, they may employ statistical analysis to find correlations, or clustering to identify outliers.
- Once we find discrepancies, we typically need to define and apply (a series of) transformations to correct them
Data Integration
- Data mining often requires data integration—the merging of data from multiple data stores.
- Careful integration can help reduce and avoid redundancies and inconsistencies in the resulting data set.
- This can help improve the accuracy and speed of the subsequent data mining process.
How can we match schema and objects from different sources?
- Entity Identification Problem:
- It is likely that your data analysis task will involve data integration, which combines data from multiple sources into a coherent data store, as in data warehousing.
- These sources may include multiple databases, data cubes, or flat files.
- Schema integration and object matching can be tricky.
- How can equivalent real-world entities from multiple data sources be matched up?
- This is referred to as the entity identification problem
- For example, how can the data analyst or the computer be sure that customer id in one database and cust number in another refer to the same attribute?
- Examples of metadata for each attribute include the name, meaning, data type, and range of values permitted for the attribute, and null rules for handling blank, zero, or null values
- Such metadata can be used to help avoid errors in schema integration.
- When matching attributes from one database to another during integration, special attention must be paid to the structure of the data.
- This is to ensure that any attribute functional dependencies and referential constraints in the source system match those in the target system.
- For example, in one system, a discount may be applied to the order, whereas in another system it is applied to each individual line item within the order.
- If this is not caught before integration, items in the target system may be improperly discounted
- Redundancy:
- Redundancy is another important issue in data integration. An attribute (such as annual revenue, for instance) may be redundant if it can be “derived” from another attribute or set of attributes.
- Inconsistencies in attribute or dimension naming can also cause redundancies in the resulting data set.
- Correlation Analysis:
- Some redundancies can be detected by correlation analysis.
- Correlation Analysis in Data Mining is a statistical technique used to identify and measure the strength of relationships between two or more variables in a data set
- Given two attributes, such analysis can measure how strongly one attribute implies the other, based on the available data. For nominal data, we use the χ2 (chi- square) test.
- For numeric attributes, we can use the correlation coefficient and covariance, both of which access how one attribute’s values vary from those of another.