DWDM-03 Data Warehouse
On This Page
Data Warehouse
- A data warehouse is a subject-oriented, integrated, time-variant, and non-volatile collection of data in support of management’s decision making process.
- The four keywords—subject-oriented, integrated, time-variant, and non-volatile—distinguish data warehouses from other data repository systems, such as relational database systems, transaction processing systems, and file systems.
Key Features of a Data Warehouse
A data warehouse is a centralized repository of integrated data collected from different sources. It is designed to support decision-making processes by providing historical, subject-oriented, and consistent information.
Subject-Oriented
- A data warehouse is organized around major subjects such as customers, suppliers, products, and sales.
- Unlike operational systems that focus on day-to-day transaction processing, the data warehouse emphasizes modeling and analysis of data for decision-makers.
- It provides a concise and simplified view of specific subject areas by excluding irrelevant or unnecessary data.
- Example: Instead of storing every transaction detail, the warehouse may summarize customer purchasing behavior over time.
Integrated
- A data warehouse is built by integrating data from multiple heterogeneous sources, such as:
- Relational databases
- Flat files
- Online transaction processing (OLTP) systems
- Data cleaning and data integration techniques ensure consistency in:
- Naming conventions
- Encoding structures
- Attribute measurements
- Example: If one system stores gender as "M/F" and another as "Male/Female," the warehouse integrates them into a consistent format.
Time-Variant
- A data warehouse stores data over a long time horizon (typically 5–10 years or more).
- Historical data provides trends and patterns that are crucial for forecasting, strategic planning, and decision-making.
- Every key structure (tables, records, attributes) in the warehouse contains a time dimension, either explicitly (timestamps, date fields) or implicitly.
- Example: Sales data can be analyzed by year, quarter, month, or week to identify seasonal patterns.
Non-Volatile
- A data warehouse is a separate data store, distinct from operational databases.
- Once entered, data is generally not updated or deleted; instead, it is appended with new historical data.
- Because of this non-volatile nature, the warehouse does not require:
- Transaction processing
- Recovery mechanisms
- Concurrency control
- Only two main operations are performed:
- Initial data loading (bulk data transfer from sources)
- Data access/retrieval (queries and analysis)
- This ensures stable, reliable data for decision support.
Differences between Operational Database Systems and Data Warehouse
OLTP (Online Transaction Processing)
- OLTP systems are database systems designed to manage and support transaction-oriented applications in real-time.
- Their main role is to perform day-to-day business operations such as sales, banking, payroll, and reservations.
- The major task of online operational database systems is to perform online transaction and query processing.
Key Features of OLTP
- Transaction-Oriented
- Handles a large number of short, simple transactions.
- Example: ATM withdrawal, product purchase, student registration.
- Real-Time Processing
- Transactions are processed immediately to keep the database up to date.
- Concurrency Control
- Many users can perform transactions simultaneously without conflict.
- Current Data
- Maintains up-to-date operational data.
- Normalized Database Design
- Data is highly normalized to avoid redundancy and ensure consistency.
- Performance Goal
- Optimized for fast insert, update, and delete operations rather than complex analysis.
- Application Areas
- Banking systems, airline ticket booking, e-commerce platforms, payroll, inventory, and student registration systems.
OLAP (Online Analytical Processing)
- OLAP systems are database systems designed for analysis, decision support, and data mining.
- They are built on data warehouses and focus on querying, reporting, and multidimensional analysis.
Key Features of OLAP
- Analysis-Oriented
- Performs complex queries and analytical calculations instead of simple transactions.
- Historical Data
- Works on large volumes of historical and summarized data (not real-time).
- De-normalized Database Design
- Data is stored in star schema, snowflake schema, or fact-dimension models for efficient querying.
- Read-Mostly System
- Optimized for queries, not for frequent updates or deletes.
- Multidimensional Analysis
- Supports slicing, dicing, drilling down, and pivoting of data.
- Performance Goal
- Designed to support decision-making, not operational tasks.
- Application Areas
- Business intelligence, trend analysis, forecasting, strategic planning, and data mining.
Difference: OLTP & OLAP
| Aspect | OLTP (Online Transaction Processing) | OLAP (Online Analytical Processing) |
|---|---|---|
| Characteristic | Operational processing | Informational processing |
| Orientation | Transaction-based | Analysis-based |
| Primary Task | Performs online transaction and query processing | Provides decision support through data analysis |
| User | Clerks, DBAs, database professionals | Knowledge workers (e.g., managers, executives, analysts) |
| Function | Supports day-to-day operations (purchasing, inventory, payroll, registration, accounting, banking) | Supports long-term informational requirements and complex decision-making |
| DB Design | ER-model based, application-oriented | Star schema / Snowflake schema, subject-oriented |
| Data | Current, up-to-date, real-time | Historical, accuracy maintained over time |
| Summarization | Primitive, highly detailed | Summarized, consolidated |
| View | Detailed, flat relational view | Summarized, multidimensional view |
| Unit of Work | Short, simple transactions | Complex queries |
| Access Pattern | Frequent Read/Write | Mostly Read |
| Focus | Data In (capturing and updating data) | Information Out (reporting, analysis, insights) |
| Operations | Index/hash on primary key | Lots of scans |
| Number of Records | Tens | Millions |
| Number of Users | Thousands | Hundreds |
| Database Size | GB to high-order GB | ≥ TB |
| Priority | High performance, high availability | High flexibility, end-user autonomy |
| Metric | Transaction throughput | Query throughput, response time |
| Examples | Banking systems, airline reservations, retail sales | Data warehouses, business reporting, trend analysis, forecasting |
Why Have a Separate Data Warehouse
A separate data warehouse is maintained alongside operational databases because both serve different purposes, have different workloads, and require different optimization strategies.
Performance Optimization
-
Operational Databases (OLTP):
- Designed for transaction processing (insert, update, delete, read).
- Optimized for tasks such as indexing, hashing on primary keys, searching specific records, and query optimization.
- Workload involves many short, concurrent transactions.
-
Data Warehouse (OLAP):
- Designed for complex queries involving computation of large data groups, summarization, and aggregation.
- Requires special organization methods, often based on multidimensional data models (star/snowflake schemas).
- Workload involves fewer but very complex queries that scan and summarize large amounts of historical data.
Concurrency and Recovery Requirements
-
OLTP Systems:
- Require concurrency control and recovery mechanisms (e.g., locking, logging) to ensure consistency and robustness of simultaneous transactions.
- Performance depends on maintaining fast response times under heavy concurrent user loads.
-
OLAP Systems:
- OLAP queries are often read-only and focus on aggregation.
- If OLAP queries used the same concurrency and recovery mechanisms as OLTP, they could block or slow down transaction processing.
- This would substantially reduce the throughput of OLTP systems.
Data Characteristics
-
Operational Databases:
- Store current, detailed, raw data (e.g., transaction-level data such as sales, banking, payroll).
- Typically do not maintain historical data.
-
Data Warehouses:
- Store historical, consolidated, and integrated data for decision-making.
- Data is cleaned, transformed, and aggregated from multiple heterogeneous sources.
- Provides high-quality, subject-oriented, time-variant data suitable for analysis.
Functional Differences
-
OLTP:
- Function: Run day-to-day business operations.
- Focus: Efficiency, availability, and correctness of individual transactions.
- Example: ATM withdrawals, airline reservations, order processing.
-
OLAP:
- Function: Support decision-making and strategic planning.
- Focus: Trends, patterns, and aggregated results from large datasets.
- Example: Analyzing customer buying behavior, forecasting sales, risk management.
Because OLTP and OLAP serve different objectives, workloads, and data requirements, it is presently necessary to maintain separate databases: _ OLTP for operational efficiency. _ OLAP (Data Warehouse) for decision support, analysis, and strategic insights.
Data Warehousing: A Multitiered Architecture
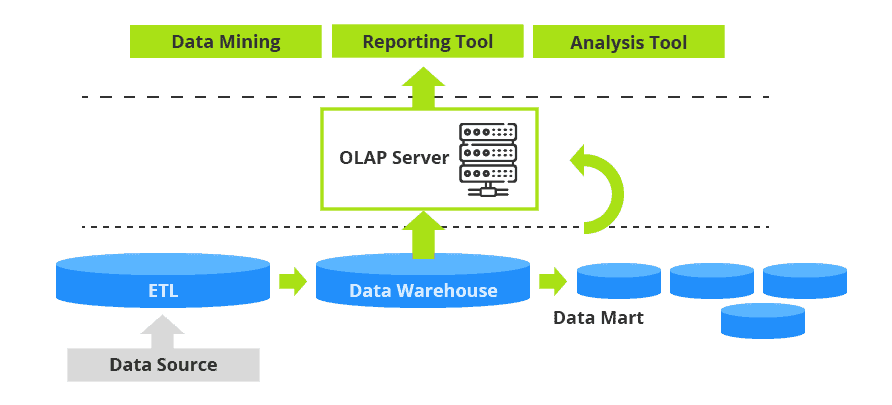
Data warehouses are typically built on a three-tier architecture that separates data storage, data processing, and data presentation. This layered approach improves scalability, performance, and maintainability.
Bottom Tier – Data Warehouse Database Server
-
The bottom tier is the data warehouse server, usually implemented as a relational database system (RDBMS).
-
Functions:
- Stores the actual data for the warehouse.
- Uses back-end tools and utilities for:
- Data Extraction: Collecting data from operational databases and external sources (e.g., CRM systems, consultant-provided data).
- Data Cleaning & Transformation: Standardizing formats, resolving inconsistencies, merging similar data.
- Data Loading & Refreshing: Updating the warehouse with new or modified data.
-
Gateways: Interfaces used for data extraction from heterogeneous sources.
- Enable client applications to generate SQL queries for execution on the server.
- Common gateways include:
- ODBC (Open Database Connectivity) – Standard API for accessing databases.
- OLE DB (Object Linking and Embedding Database) – Microsoft’s interface for accessing diverse data sources.
- JDBC (Java Database Connectivity) – Java-based interface for relational databases.
-
Metadata Repository:
- Stores information about warehouse contents (e.g., schema, data sources, transformations, mappings).
- Essential for management, integration, and querying.
Middle Tier – OLAP Server
- The middle tier is responsible for enabling OLAP (Online Analytical Processing) functionality.
- Implemented in one of two ways:
- ROLAP (Relational OLAP):
- Uses an extended relational DBMS.
- Multidimensional operations (slice, dice, roll-up, drill-down) are mapped to relational queries.
- Scales well for very large datasets.
- MOLAP (Multidimensional OLAP):
- Uses a special-purpose server that directly stores and manages data in multidimensional form (cubes).
- Offers faster query performance for pre-computed aggregations.
- Efficient for complex, multidimensional queries.
- ROLAP (Relational OLAP):
- Sometimes, a hybrid approach (HOLAP) is also used, combining features of ROLAP and MOLAP.
Top Tier – Front-End Tools
- The top tier is the client layer where users interact with the data warehouse.
- Provides tools for:
- Query and Reporting: Simple queries, dashboards, and static reports.
- Analytical Processing: OLAP operations (drill-down, roll-up, slice, dice).
- Data Mining: Discovering patterns, trends, and predictions.
- Visualization Tools: Charts, graphs, and dashboards for better decision-making.
| Tier | Main Component | Function |
|---|---|---|
| Bottom | Data warehouse DB server | Stores data; handles ETL (extraction, transformation, loading); maintains metadata. |
| Middle | OLAP server (ROLAP/MOLAP) | Provides analytical processing and multidimensional modeling. |
| Top | Front-end tools | Provides user access for querying, reporting, analysis, mining, and visualization. |
Data Warehouse Models
- From the architecture point of view, data warehouses can be implemented in three models:
- Enterprise Data Warehouse (EDW)
- Data Mart
- Virtual Warehouse
Enterprise Data Warehouse (EDW)
-
An enterprise warehouse collects information about subjects spanning the entire organization.
-
Provides corporate-wide data integration from multiple operational systems and external sources.
-
Scope:
- Cross-functional (covers multiple business areas).
-
Contents:
- Contains both detailed data and summarized data.
- Size may range from gigabytes to terabytes or beyond.
-
Implementation:
- Can be implemented on mainframes, superservers, or parallel architecture platforms.
- Requires extensive business modeling and may take years to design and build.
-
Use Case:
- Suitable for large organizations requiring a single, integrated view of enterprise-wide data.
Data Mart
-
A data mart contains a subset of corporate-wide data, focusing on specific subjects or departments.
-
Scope:
- Limited to selected subjects (e.g., marketing, sales, or finance).
- Example: A marketing data mart may include only customer, item, and sales data.
-
Contents:
- Data is typically summarized for quick analysis.
-
Implementation:
- Implemented on low-cost departmental servers (Unix/Linux/Windows-based).
- Faster to deploy (measured in weeks rather than years).
-
Challenges:
- May cause integration issues if not planned with enterprise-wide consistency.
-
Types of Data Marts:
- Independent Data Mart
- Sourced directly from operational systems or external providers.
- Designed and managed at the department level.
- Dependent Data Mart
- Sourced directly from the enterprise data warehouse (EDW).
- Ensures consistency and integration across departments.
- Independent Data Mart
- Use Case:
- Useful for departments needing fast and subject-specific analysis without depending on a full EDW.
Virtual Warehouse
-
A virtual warehouse consists of a set of views over operational databases rather than storing data physically.
-
Contents:
- Provides an integrated view of data without requiring a separate warehouse database.
- Only some summary views may be materialized (stored) for efficiency.
-
Advantages:
- Easier and faster to build compared to EDW or data marts.
- Requires fewer resources initially.
-
Disadvantages:
- Relies heavily on the capacity of operational database servers.
- May affect the performance of transactional systems.
-
Use Case:
- Suitable for organizations that want quick deployment and do not yet need a full-scale warehouse.
| Feature | Enterprise Data Warehouse (EDW) | Data Mart | Virtual Warehouse |
|---|---|---|---|
| Scope | Entire organization, cross-functional | Specific department or subject area | Logical views over operational databases |
| Data | Detailed + summarized | Mostly summarized | Views (some materialized) |
| Implementation | Large-scale, time-consuming (years) | Quick (weeks to months) | Easy and fast |
| Cost | High | Moderate to low | Low (depends on operational DB capacity) |
| Integration | Strong, consistent | May lack integration if independent | Limited |
| Best for | Large enterprises with complex needs | Departments needing focused insights | Organizations needing quick setup |
Top-Down and Bottom-Up Approaches in Data Warehouse Development
- When designing and deploying a data warehouse, organizations typically follow either a top-down approach or a bottom-up approach
Top-Down Approach
-
Starts with the development of an Enterprise Data Warehouse (EDW) covering the entire organization.
-
From the EDW, dependent data marts are created for different departments or business units.
-
Advantages:
- Provides a systematic and comprehensive solution.
- Ensures strong data integration across the organization.
- Facilitates consistency in data models, naming conventions, and business rules.
- Reduces long-term issues with data redundancy and integration conflicts.
-
Disadvantages:
- Expensive and resource-intensive.
- Requires long development time (may take years).
- Rigid – difficult to adapt to changes or evolving business needs.
- Achieving consensus for a common data model across the organization can be challenging.
Bottom-Up Approach
-
Starts with the creation of independent data marts for specific departments or functions.
-
Later, these data marts may be integrated into a broader enterprise warehouse.
-
Advantages:
- Faster deployment – shorter development cycles.
- Lower cost compared to a top-down EDW.
- Provides quick return on investment (ROI).
- Flexible – allows experimentation and adaptation for specific departmental needs.
-
Disadvantages:
- May result in inconsistent data definitions across different data marts.
- Integration issues may arise when combining multiple disparate data marts.
- Risk of data silos and redundancy if not coordinated with enterprise-wide planning.
- Long-term maintenance and scaling may be more complex.
Hybrid (Federated) Approach
-
Combines both strategies: an overall enterprise-wide architecture is planned (top-down), but incremental data marts are built first (bottom-up).
-
These data marts follow the enterprise-wide standards, ensuring integration.
-
Advantages:
- Provides quick results like the bottom-up approach.
- Maintains long-term integration and consistency like the top-down approach.
- Cost-effective and practical in real-world implementations.
| Feature | Top-Down Approach | Bottom-Up Approach | Hybrid Approach |
|---|---|---|---|
| Starting Point | Enterprise Data Warehouse (EDW) | Independent Data Marts | Data Marts aligned with EDW architecture |
| Cost | High | Lower | Moderate |
| Development Time | Long (years) | Short (weeks/months) | Medium |
| Flexibility | Low | High | Medium-High |
| Integration | Strong and consistent | Weak, may lead to silos | Strong |
| Return on Investment | Slow | Quick | Balanced |
| Best for | Large organizations with long-term vision | Organizations needing quick insights | Most real-world use cases |
Recommended Approach for Data Warehouse Development
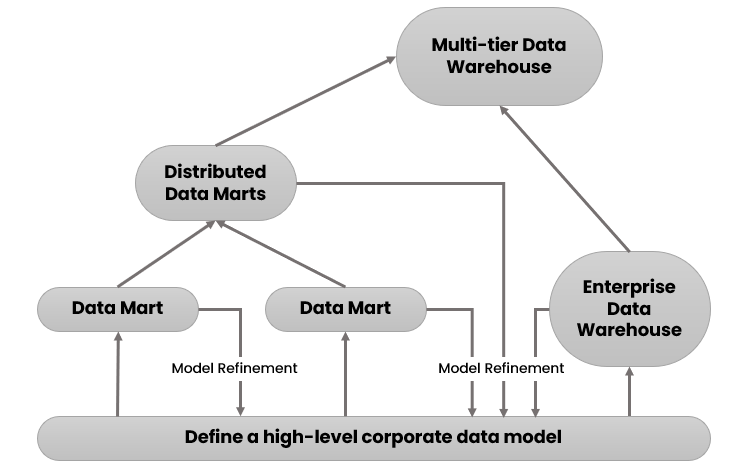
- A recommended method for the development of data warehouse systems is to implement the warehouse in an incremental and evolutionary manner, as shown in figure.
- First, a high-level corporate data model is defined within a reasonably short period (such as one or two months) that provides a corporate-wide, consistent, integrated view of data among different subjects and potential usages.
- This high-level model, although it will need to be refined in the further development of enterprise data warehouses and departmental data marts, will greatly reduce future integration problems.
- Second, independent data marts can be implemented in parallel with the enterprise warehouse based on the same corporate data model set noted before.
- Third, distributed data marts can be constructed to integrate different data marts via hub servers
- Finally, a multitier data warehouse is constructed where the enterprise warehouse is the sole custodian of all warehouse data, which is then distributed to the various dependent data marts
Extraction, Transformation, and Loading
- Data extraction, which typically gathers data from multiple, heterogeneous, and external sources.
- Data cleaning, which detects errors in the data and rectifies them when possible.
- Data transformation, which converts data from legacy or host format to warehouse format.
- Load, which sorts, summarizes, consolidates, computes views, checks integrity, and builds indices and partitions.
- Refresh, which propagates the updates from the data sources to the warehouse
Data Warehouse Modelling
- Data warehouses and OLAP tools are based on a multidimensional data model.
- This model views data in the form of a data cube.
- OLAP operations such as drill-down and roll-up are illustrated further
Data Cube: A Multidimensional Data Model
- A data cube allows data to be modelled and viewed in multiple dimensions. It is defined by dimensions and facts.
- Dimensions are the perspectives or entities with respect to which an organization wants to keep records.
- For example, All Electronics may create a sales data warehouse in order to keep records of the store’s sales with respect to the dimensions time, item, branch, and location.
- These dimensions allow the store to keep track of things like monthly sales of items and the branches and locations at which the items were sold.
- Each dimension may have a table associated with it, called a dimension table, which further describes the dimension.
- For example, a dimension table for item may contain the attributes item name, brand, and type.
- Dimension tables can be specified by users or experts, or automatically generated and adjusted based on data distributions.
- A multidimensional data model is typically organized around a central theme, such as sales. This theme is represented by a fact table.
- Facts are numeric measures. Think of them as the quantities by which we want to analyze relationships between dimensions
- Examples of facts for a sales data warehouse include dollars sold (sales amount in dollars), units sold (number of units sold), and amount budgeted.
- The fact table contains the names of the facts, or measures, as well as keys to each of the related dimension tables.
- Although we usually think of cubes as 3-D geometric structures, in data warehousing the data cube is n dimensional.
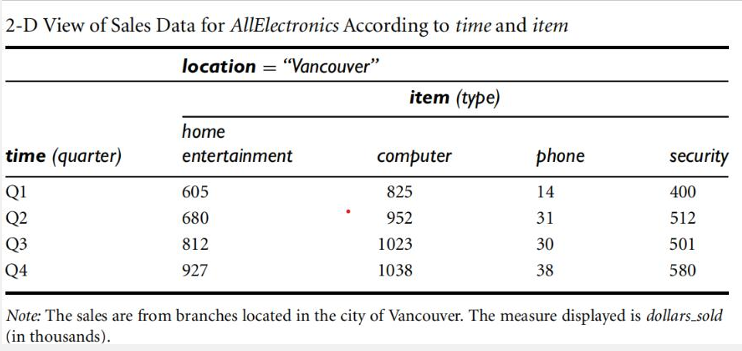
2-D Representation
- The sales for Vancouver are shown with respect to the time dimension (organized in quarters) and the item dimension (organized according to the types of items sold).
- The fact or measure displayed is dollars sold (in thousands).
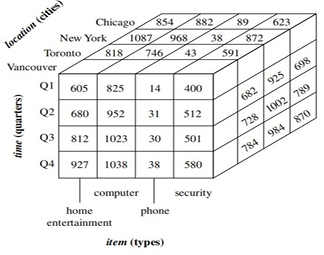
3-D Representation
- Suppose that we would like to view the sales data with a third dimension.
- For instance, suppose we would like to view the data according to time and item, as well as location, for the cities Chicago, New York, Toronto, and Vancouver.
- These 3-D data are shown in Table below. The 3-D data in the table are represented as a series of 2-D tables
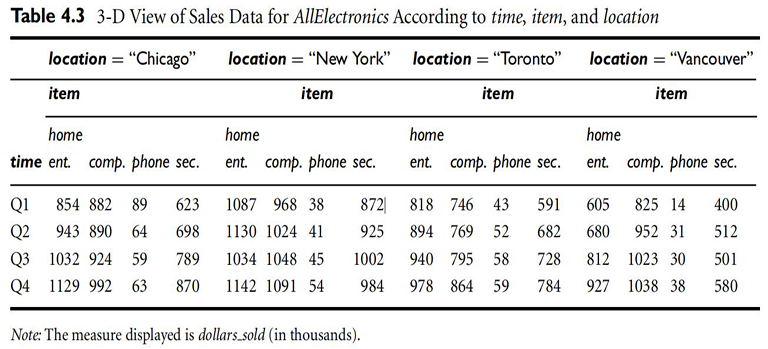
- Conceptually, we may also represent the same data in the form of a 3-D data cube, as in figure
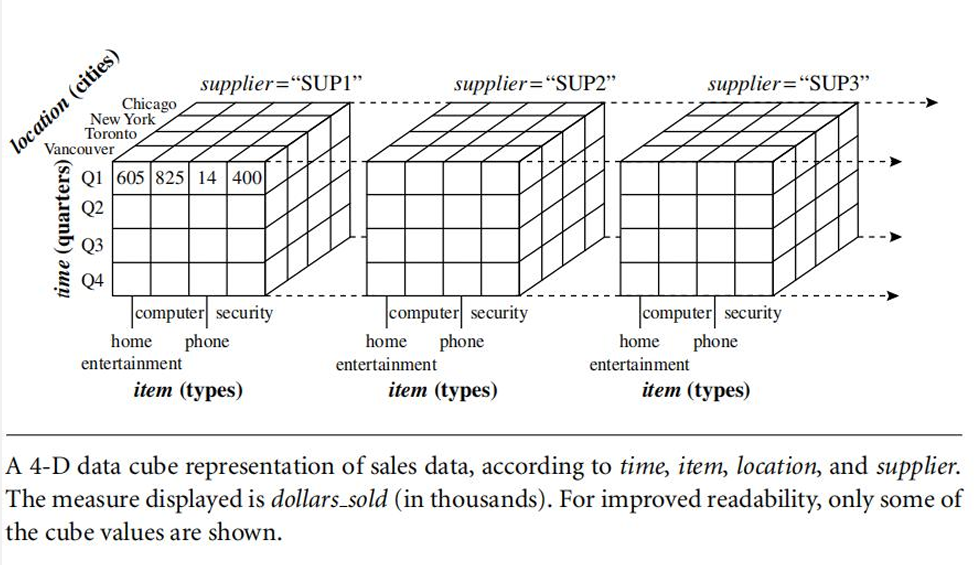
4-D Representation
- Suppose that we would now like to view our sales data with an additional fourth dimension such as supplier.
- Viewing things in 4-D becomes tricky.
- However, we can think of a 4-D cube as being a series of 3-D cubes, as shown in Figure
Schemas for Multidimensional Data Models
- The most popular data model for a data warehouse is a multidimensional model, which can exist in the form of:
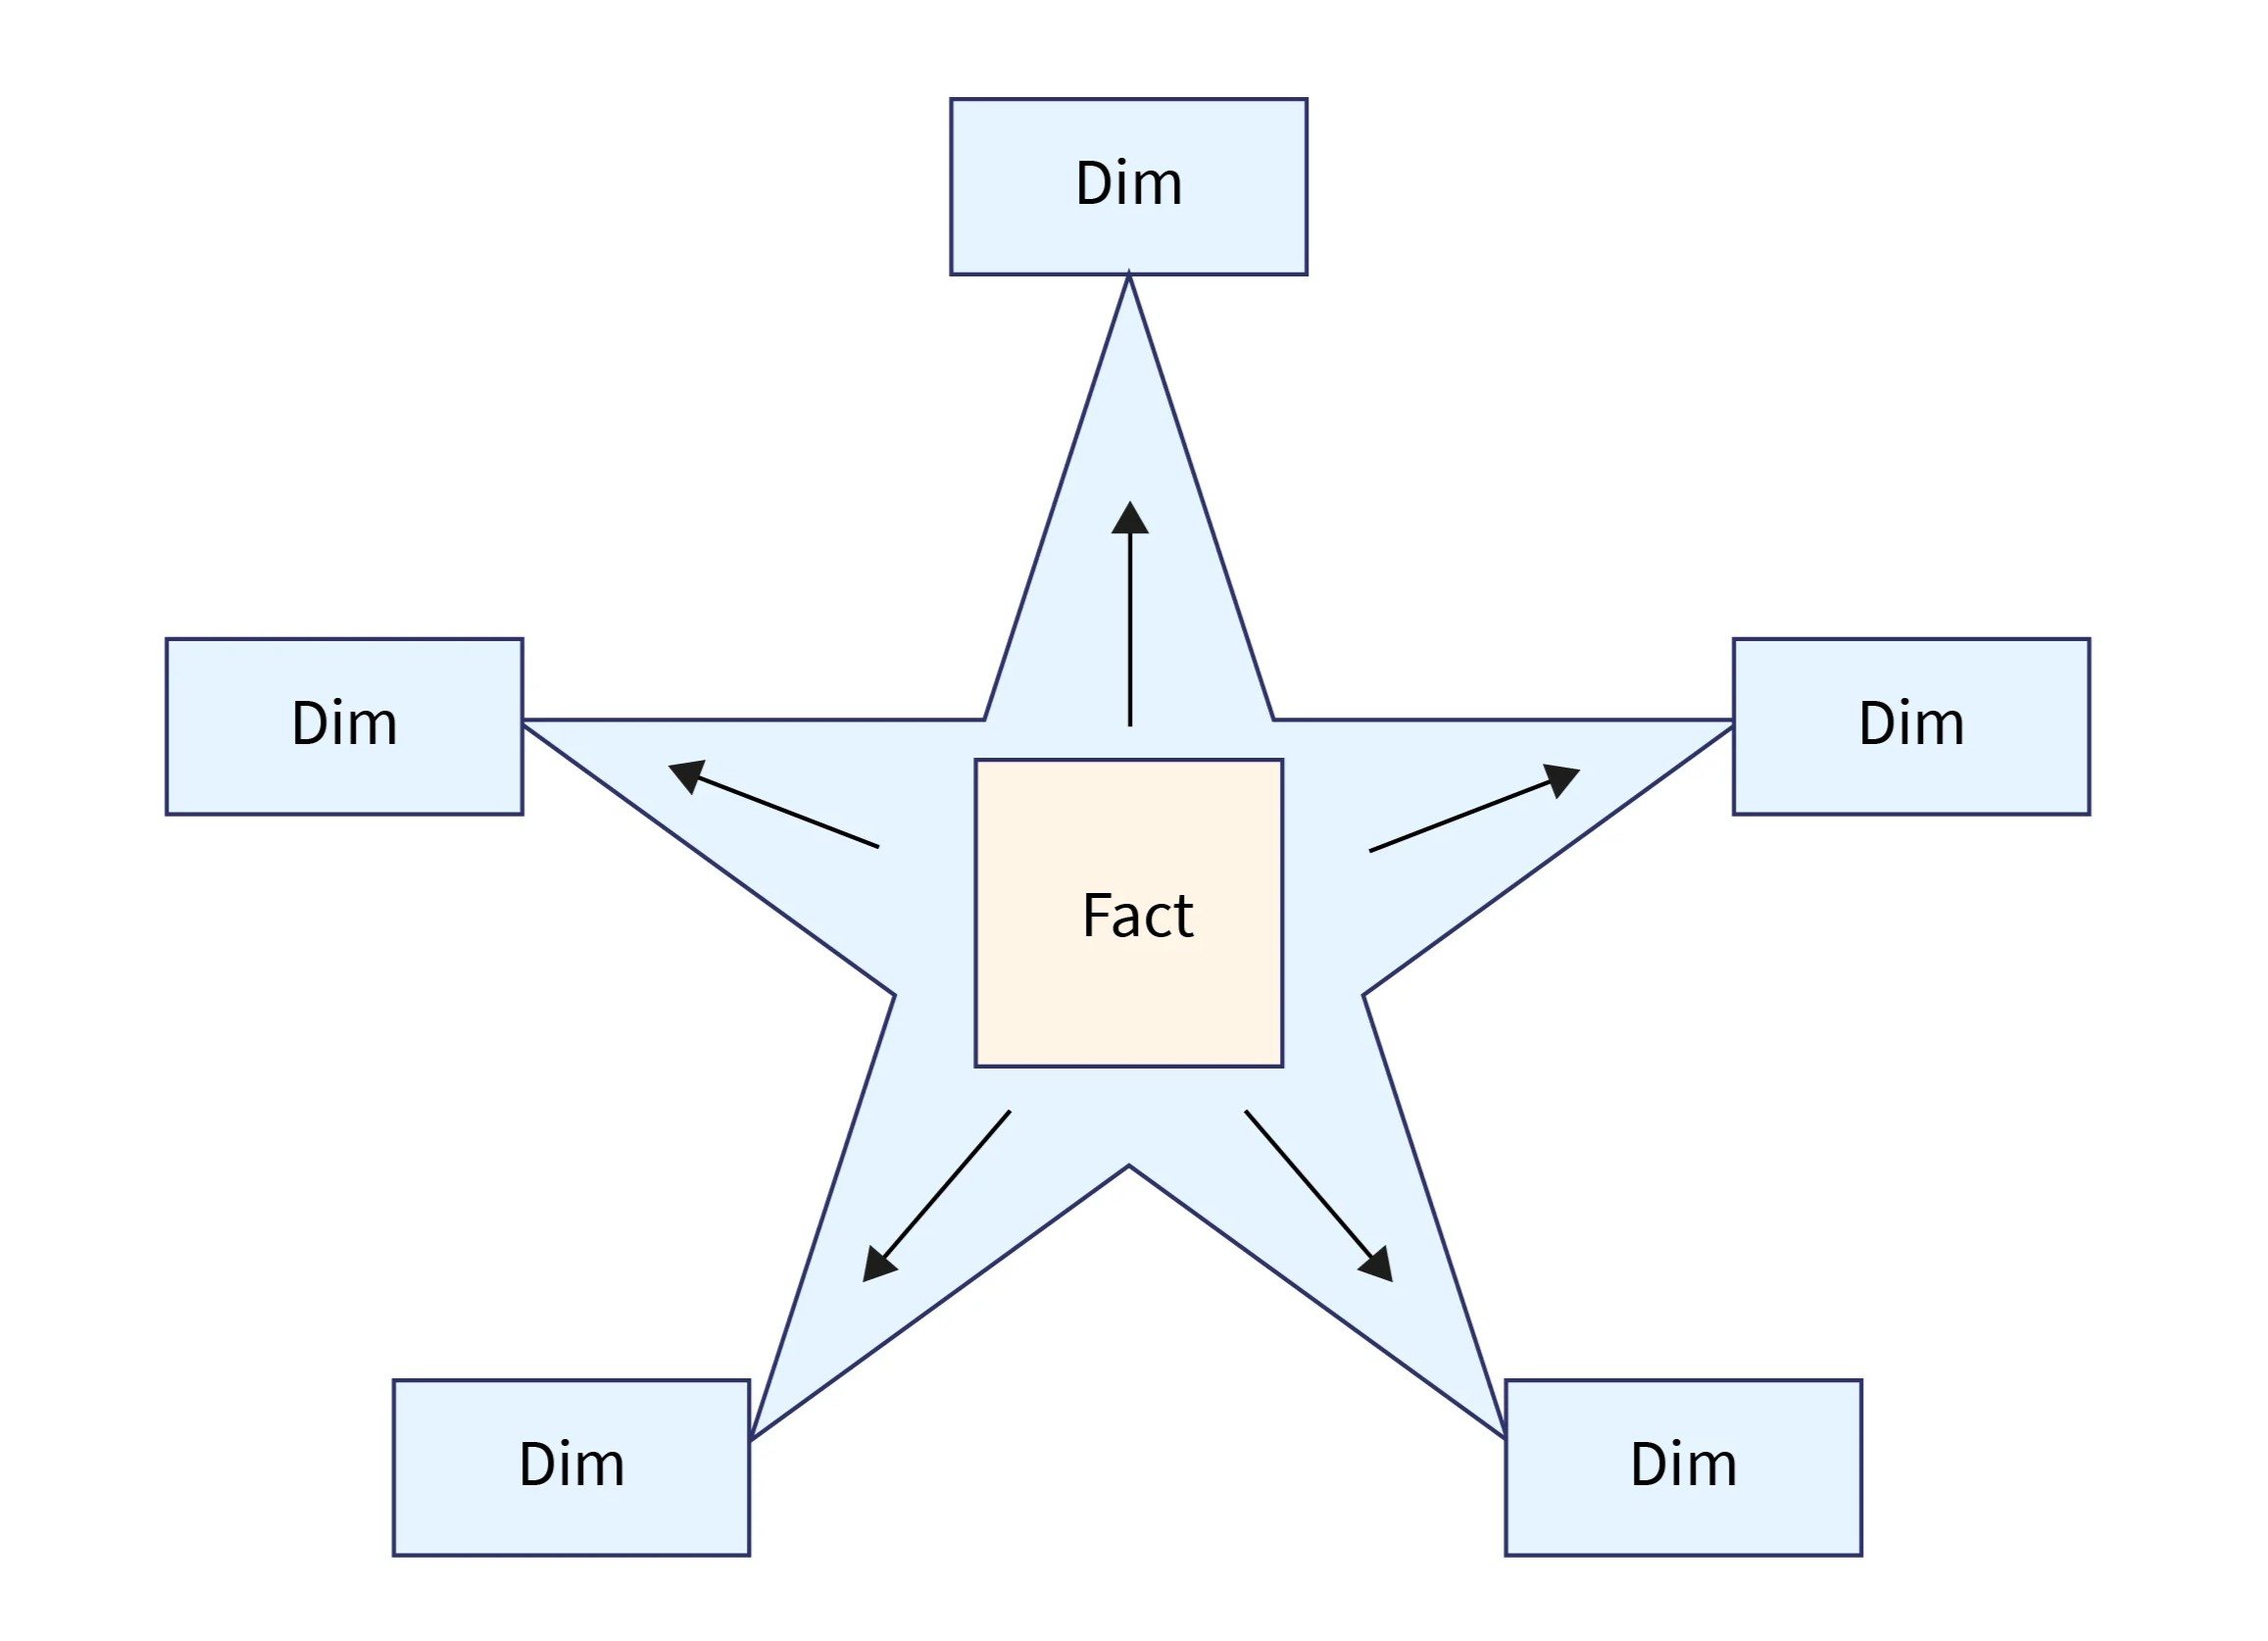
Star Schema
-
The most common modelling paradigm is the star schema, in which the data warehouse contains:
- A large central table (fact table) containing the bulk of the data, with no redundancy,
- A set of smaller attendant tables (dimension tables), one for each dimension.
-
The schema graph resembles a starburst, with the dimension tables displayed in a radial pattern around the central fact table.
-
Example: A star schema for AllElectronics sales is shown in Figure.
- Sales are considered along four dimensions: time, item, branch, and location.
- The schema contains a central fact table for sales that contains keys to each of the four dimensions, along with two measures: dollars sold and units sold.
- To minimize the size of the fact table, dimension identifiers (e.g., time key and item key) are system generated identifiers.
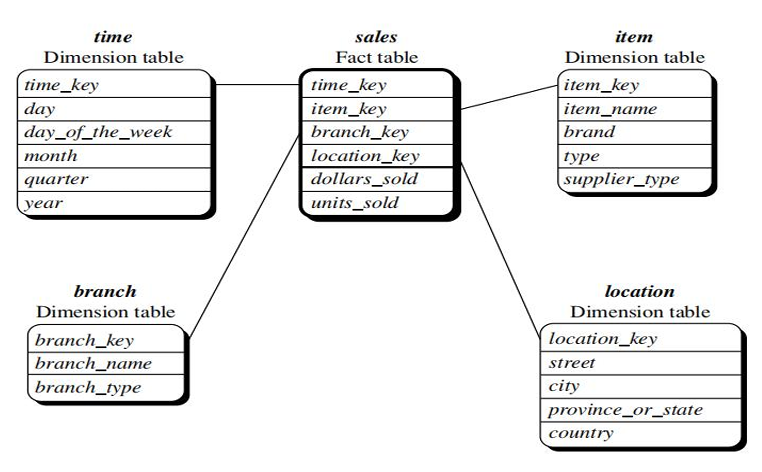
- In the star schema, each dimension is represented by only one table, and each table contains a set of attributes.
- For example, the location dimension table contains, the attribute set {location key, street, city, province or state, country}.
- This constraint may introduce some redundancy.
- For example, “Urbana” and “Chicago” are both cities in the state of Illinois, USA.
- Entries for such cities in the location dimension table will create redundancy among the attributes province or state and country
Snowflake Schema
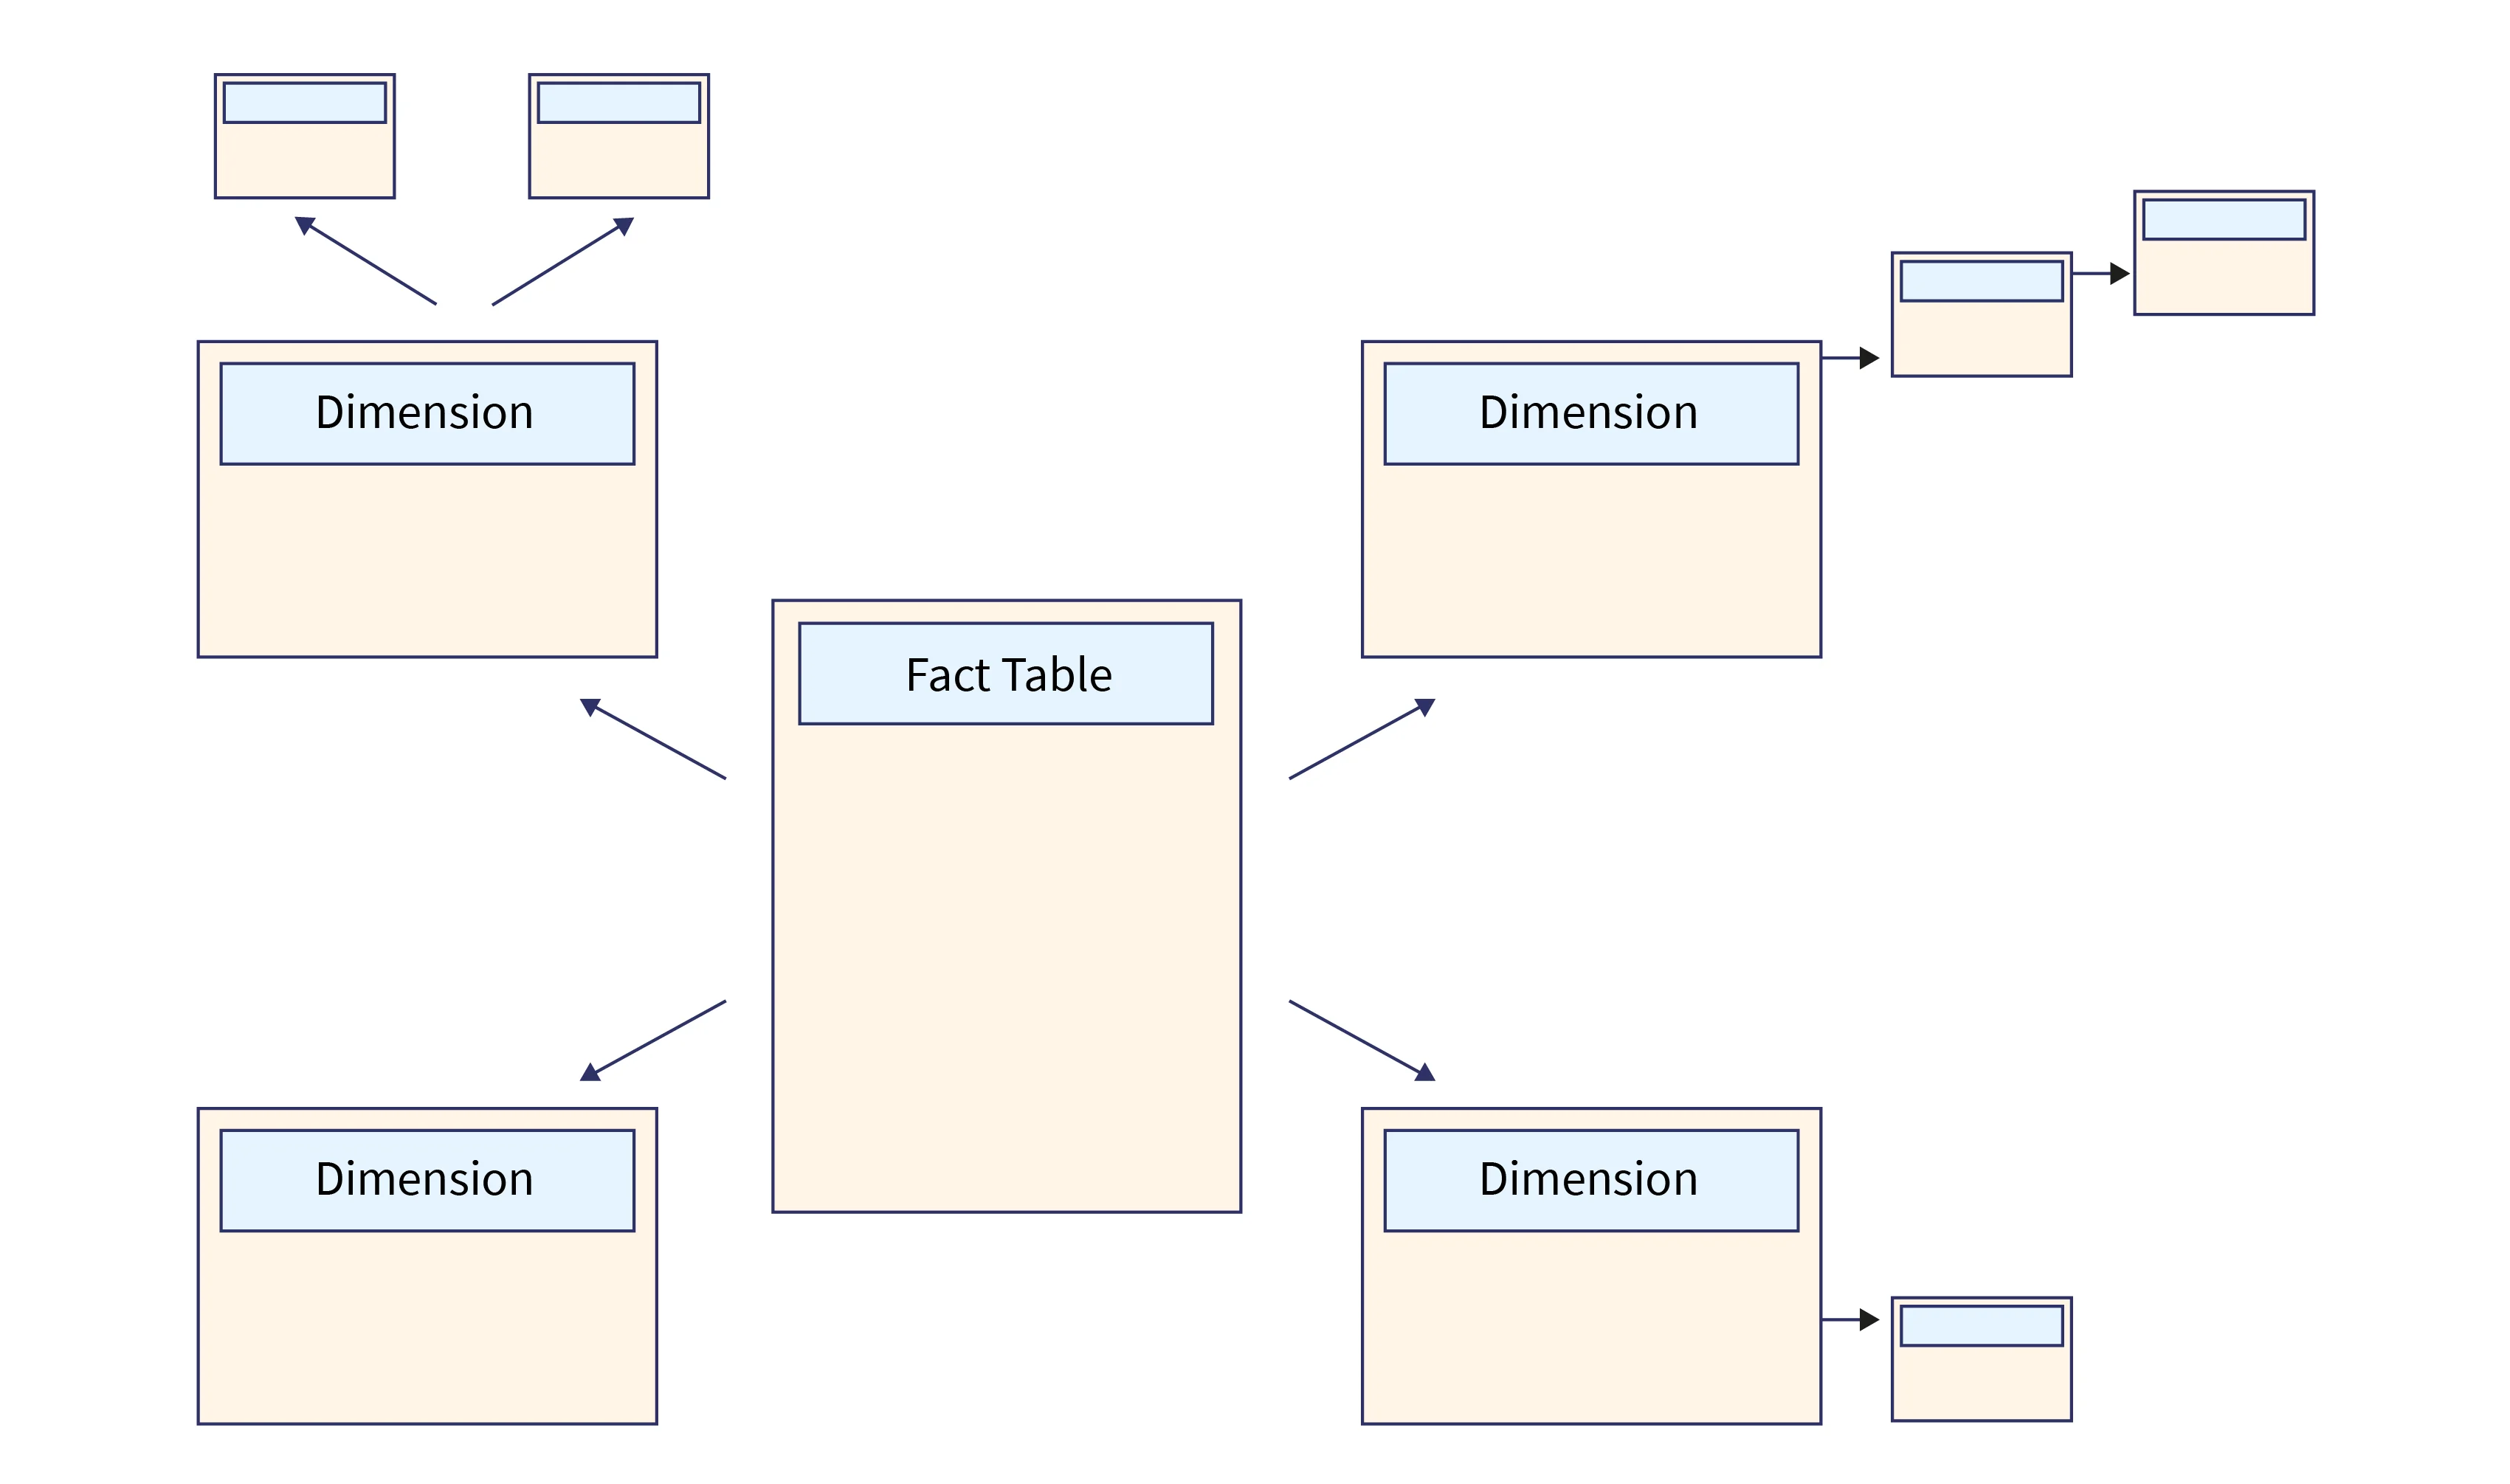
- The Snowflake schema is a data warehousing that combines efficient storage and query performance for effective data warehousing.
- The Snowflake Schema is a data warehousing strategy for organizing data to facilitate fast querying and reporting.
- Consider it a snowflake-like branching structure where data is organized into numerous tiers of normalized tables. This approach reduces data redundancy while optimizing storage.
- A primary fact table in a Snowflake Schema holds critical business KPIs, whereas dimension tables branch out and store associated information
- The strength of the Snowflake Schema is its ability to minimize storage space by avoiding data duplication.
- However, retrieving data in this format frequently necessitates more sophisticated joins between databases, which might have little impact on speed
Fact Constellation Schema
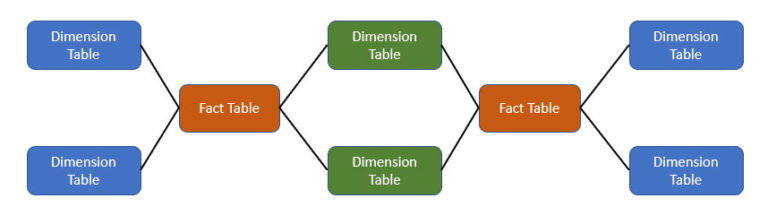
- It integrates multiple fact tables sharing common dimensions, often referred to as a "Galaxy schema."
- This approach allows businesses to conduct multi-dimensional analysis across complex datasets.
- Unlike simpler models like the Star Schema and Snowflake Schema, the Fact Constellation Schema consists of multiple fact tables that share common dimensional tables.
- This model is ideal for handling complex systems and large-scale analytical queries, offering flexibility for business intelligence and data mining.
- The core components of the Fact Constellation Schema include Fact Tables and Dimension Tables.
- Fact tables store measurable, quantitative data, such as sales or revenue, while dimension tables store descriptive attributes like time, location, or product.
- These tables are interconnected, with multiple fact tables sharing the same dimension tables.
Questions
- What is a Data Warehouse? Explain its basic concepts and significance in data analysis.
- Differentiate between Operational Database Systems and a Data Warehouse with suitable examples.
- Explain the multitier architecture of a Data Warehouse with a neat diagram.
- What are the different Data Warehouse Models? Explain Enterprise Warehouse, Data Mart, and Virtual Warehouse.
- What is a Data Cube in OLAP? Explain Stars, Snowflakes, and Fact Constellations (schemas) in multidimensional data models.